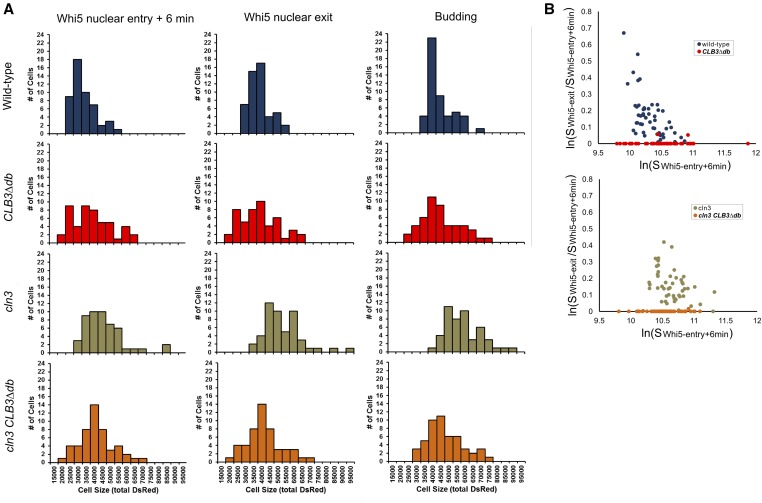
Figure 8.
Analysis of cell size control in wild-type, CLB3∆db, cln3, and cln3 CLB3∆db cells. (A) Distribution of cell sizes (total DsRed) in wild-type, CLB3∆db, cln3, and cln3 CLB3∆db cells at birth (estimated as time of Whi5 nuclear entry + 6 min), time of Whi5 nuclear exit, and time of budding. (B) Log relative growth [ln(SWhi5-exit/SWhi5-entry+6min)] vs. log of cell size at birth [ln(SWhi5-entry+6min)] in wild-type, CLB3∆db, cln3, and cln3 CLB3∆db cells.

