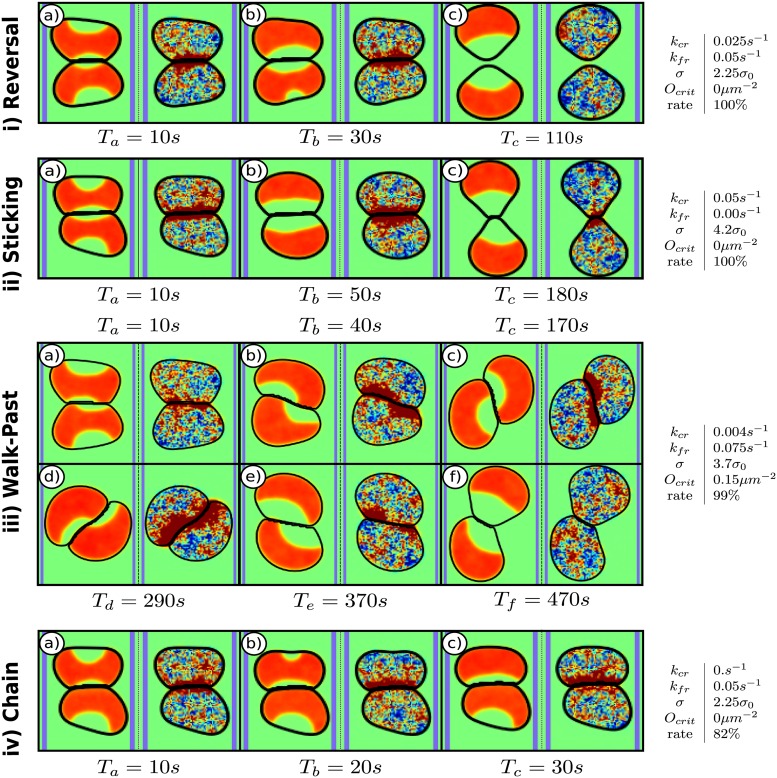
Fig 3. Snapshots of different outcomes.
In each panel ρ(r) is on the left, I(r) on the right and the edges of the adhesive micropattern are indicated in blue. α = 0.4α0 for all cases. The outcomes are i) reversals, ii) sticking, iii) walk-past, and iv) chaining. Next to each outcome are the parameters of the snapshots and the rate of the outcome for the given parameters based on 100 simulations. We chose the parameters that yield the maximum rate for each outcome. α0 = 1pN/μm3 and σ0 = 1pN/μm. Times are measured relative to the time of first contact.

