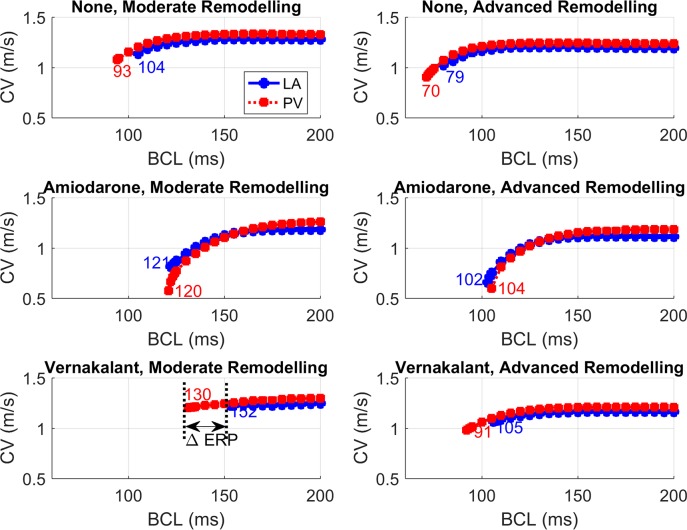
Fig 7. CV restitution curves and ERP calculated with 1D models for the PV and LA.
Conditions of moderate (left) and advanced (right) remodelling, at baseline (top) and under the action of 10 μM amiodarone (middle) and 30 μM vernakalant (bottom panels) are shown. The numbers in each panel show ERP in ms (defined as the earliest BCL that does not lead to conduction block) for each tissue type.

