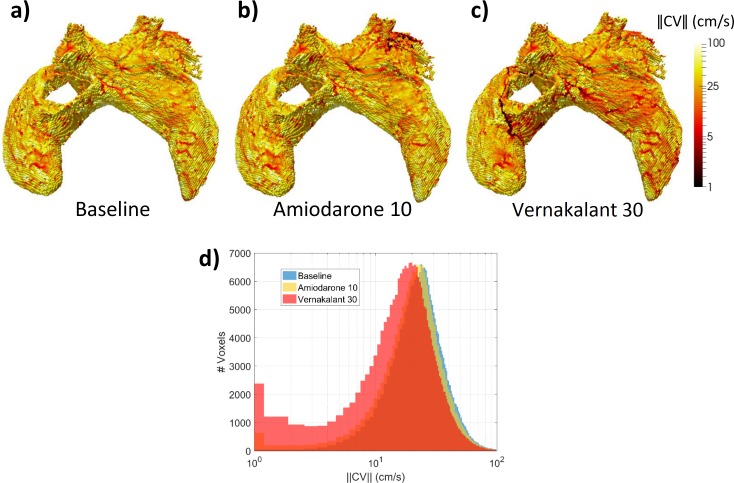
Fig 8. Drug effects on CV heterogeneity in the 3D atria model.
Whole-atria CV maps, measured after fast pacing from the LSPV at BCL = 150 ms in moderate remodelling and CV reduction conditions a) at baseline; under the actions of: b) 10 μM amiodarone and c) 30 μM vernakalant. Patchy red regions correspond to zones of decreased CV, which can also be seen in the corresponding histograms in panel d), as a slow-conduction left tail, which is most prominent in the presence of vernakalant.

