
Fig 2. Combined Aggregated Functional Traits.
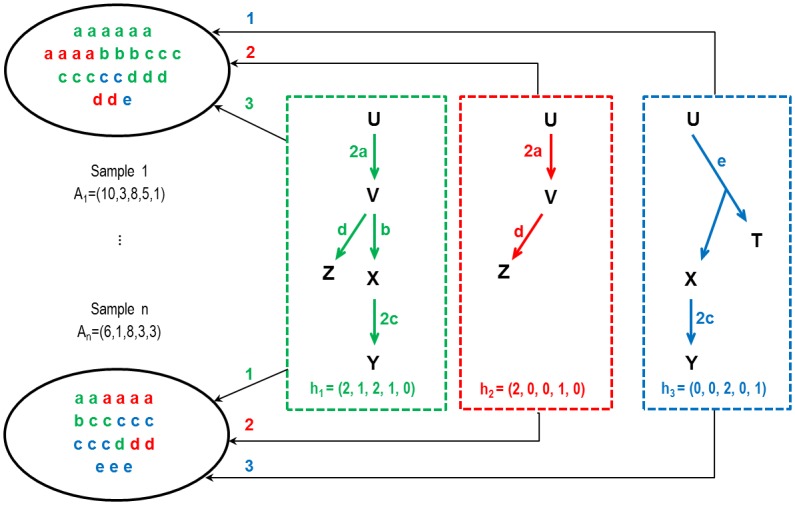
The gene association patterns in Fig 1 correspond to stable structures, representing different ways to fulfill the metabolic function of interest at the ecosystem level. At the bottom of each box, vectors h1, h2 and h3 represent functional markers abundances. We call these vectors Combined Aggregated Functional Traits (CAFTs). They should be found in all samples, possibly in varying proportions. Sample 1 is decomposed as A1 = 3h1 + 2h2 + h3 and sample n as An = h1 + 2h2 + 3h3.