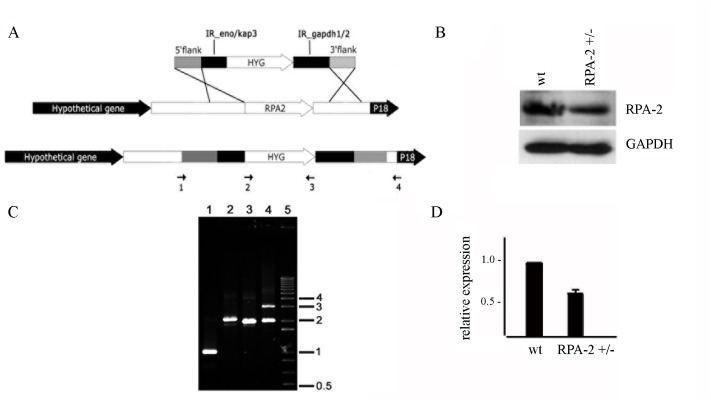
Fig 5. Generation of heterozygous knockout cells expressing reduced levels of TcRPA-2.
A. Schematic representation of the TcRPA-2 locus (central panel) or the locus generated after replacement of the RPA-2 gene by gene targeting (bottom panel) with the recombination cassette carrying the hygromycin resistance gene (top panel). Arrows indicate the regions where the primers used in the experiments presented in B anneal. B. DNA extracted from RPA-2 heterozygous knockout cells was amplified using the primers presented in A. 1- Hyg_f (2) + Hyg_r (3) (1.026 bp); 2- Hyg_f (2) + EXT5’_r (4) (2.113 bp); 3- EXT5’_f (1) + Hyg_r (3) (1.994 bp); 4- EXT5’_f (1) + EXT3’_r (4). 5–1 kb plus DNA ladder marker (Invitrogen). The primers EXT5’_f and EXT3’_r anneal in regions outside of the recombination site. Thus, the two bands observed in lane 4 correspond to the amplified regions from the wild-type (2.070 bp) and targeted RPA-2 alleles (3.081 bp), which are present in the RPA-2+/- parasites. C. Cell extracts from control and RPA-2+/- cells were subjected to SDS-PAGE, transferred onto nitrocellulose membranes and incubated with anti-rTcRPA-2 or anti-GAPDH, which was used as a loading control. D. The intensity of the bands obtained with anti-rTcRPA-2 presented on C were normalized using the intensity of the GAPDH bands. Graph shows average and standard deviation of three independents experiments.

