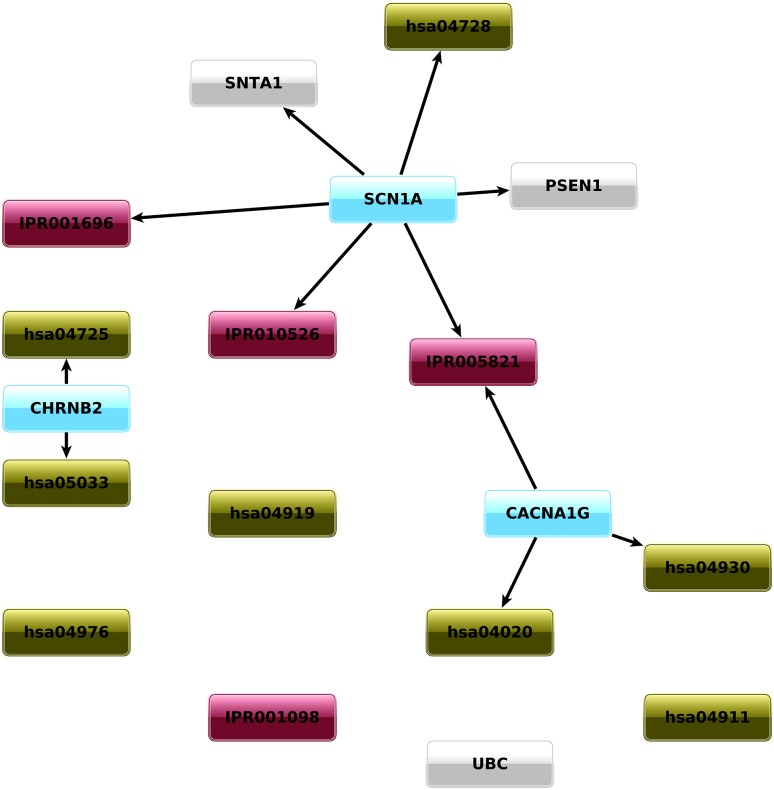
Fig 3. Interconnected, statistically significant ROIs.
Graphical representation of statistically significant ROIs and their overlapping. The direction of the arrow means that an element is included into another. Gene ROIs (light blue) can be part of pathway (green) or PPI (grey) ROIs, while domain ROIs (purple) can be part of gene ROIs.

