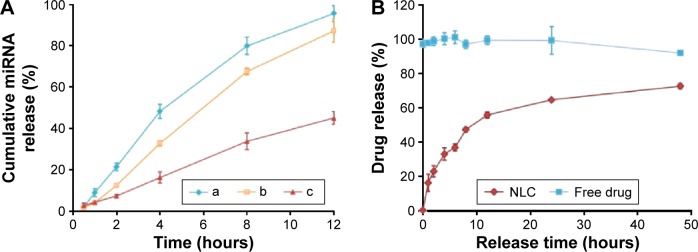
Figure 3.
Release profiles (A) of miRNA from SLN/miRNA complexes with different weight ratios in Tris-base (n=3). Lines a, b, and c represent SLN/miRNA nanoparticles at the weight ratio of 60:1, 90:1, and 120:1, respectively. Release profiles (B) of PTX from NLC/PTX. The error bars in the graphs represent the standard deviations (n=3).
Abbreviations: NLC, nanostructured lipid nanoparticles; PTX, paclitaxel; SLN, solid lipid nanoparticles; miRNA, microRNA.

