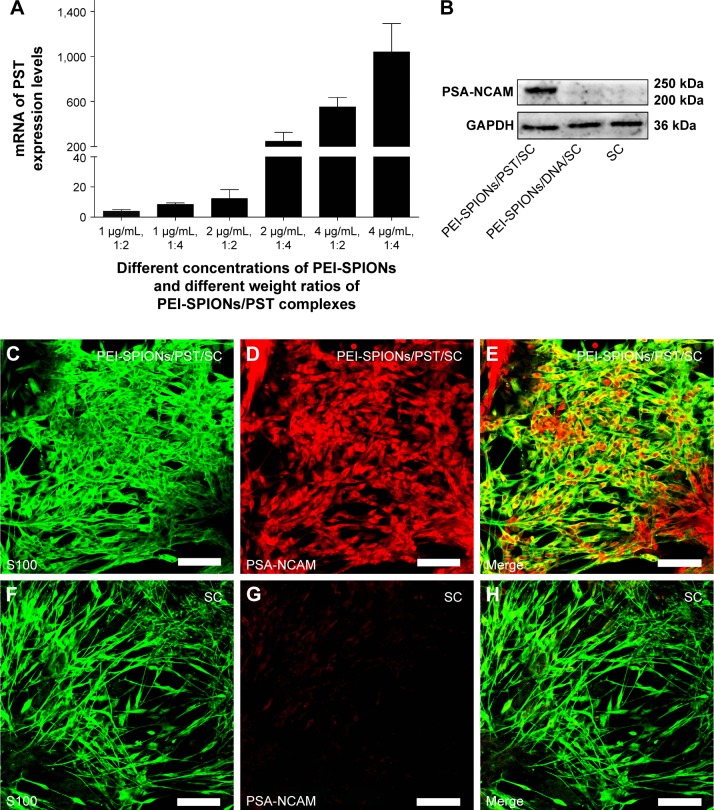
Figure 5.
Expression and translation analyses of transferred exogenous PST.
Notes: (A) At 72 h after magnetofection, mRNA levels of PST in each group (already normalized by normal control SCs). (B) At 72 h after incubation/magnetofection, detection of PSA-NCAM expression in SCs, PEI-SPIONs/DNA/SCs, and PEI-SPIONs/PST/SCs by Western blotting. An obvious PSA-NCAM-specific band was detected in PEI-SPIONs/PST/SCs, while no PSA-NCAM-specific band was found in SCs and PEI-SPIONs/DNA/SCs. (C–E) At 72 h after magnetofection, confocal images showed the abundant expression of PSA-NCAM (red) in S100-labeled PEI-SPIONs/PST/SCs (green). (F–H) No PSA-NCAM (red) was detected in S100-labeled SCs (green). Scale bar: (C–H) 100 μm. Graph bars: mean ± SD.
Abbreviations: mRNA, messenger RNA; PEI-SPIONs, polyethylenimine-coated superparamagnetic iron oxide nanoparticles; PSA-NCAM, polysialylated neural cell adhesion molecule; PST, polysialyltransferase; SCs, Schwann cells; SD, standard deviation.

