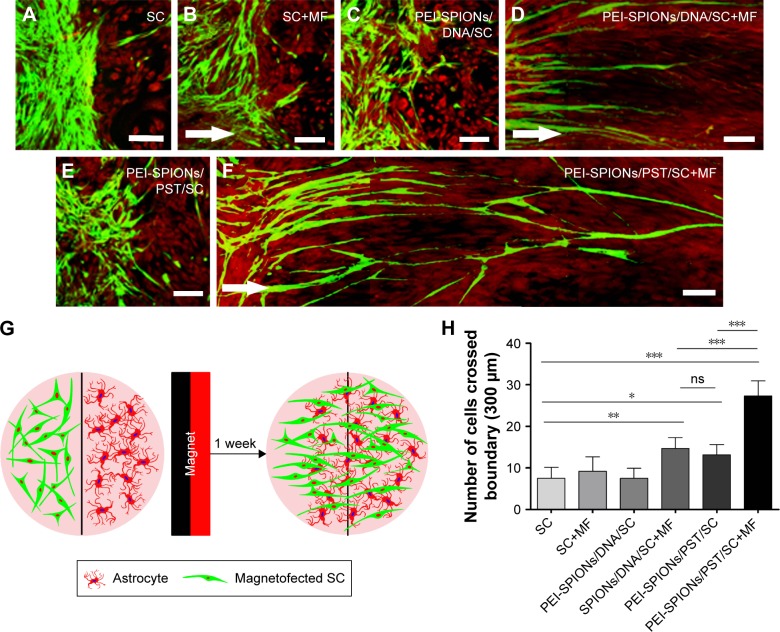
Figure 7.
Confrontation assays of SCs and astrocytes.
Notes: Immonocytochemistry images of the SC–astrocyte confrontation assay. SCs are labeled with S100 (green); astrocytes are labeled with GFAP (red). (A–F) Arrows indicate the direction of the MF. (A and B) SCs with and without an applied MF; boundaries both formed by astrocytes; (C) PEI-SPIONs/DNA/SCs formed a boundary with astrocytes in the absence of an applied MF; (D) PEI-SPIONs/DNA/SCs crossed the cell boundary in the presence of an MF. (E) PEI-SPIONs/PST/SCs migrated into the astrocyte domain while their migration had no specific direction; (F) PEI-SPIONs/PST/SCs thoroughly broke the boundary formed with astrocytes and aligned preferentially along the axis of the magnetic force under an applied MF. (G) Schematic diagram of the SC–astrocyte confrontation assay. Magnetofected SCs and astrocytes were plated in parallel strips, both were allowed to grow and migrate for 7 d under an applied MF. (H) Quantification of SCs that crossed the boundary and migrated into the astrocyte domain. The number of PEI-SPIONs/PST/SCs with an applied MF far exceeds those of the other groups. Scale bar: (A–F) 100 μm. Graph bars: mean ± SD; *P<0.05, **P<0.01, ***P<0.005.
Abbreviations: GFAP, glia fibrillary acidic protein; MF, magnetic field; ns, not significant; PEI-SPIONs, polyethylenimine-coated superparamagnetic iron oxide nanoparticles; PST, polysialyltransferase; SCs, Schwann cells; SD, standard deviation.

