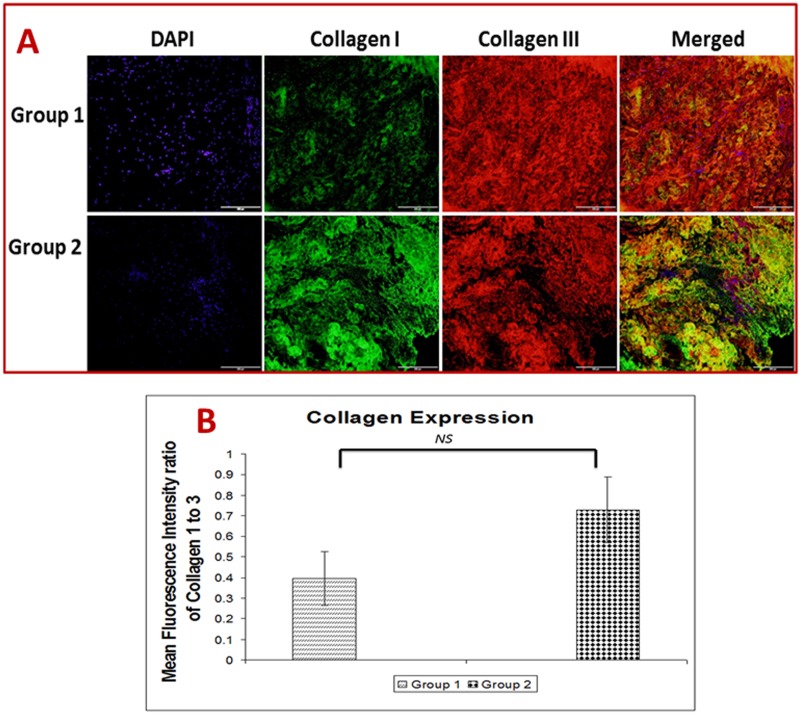
Fig 4.
(A) Immunofluorescence analysis for the expression of collagen type 1 and type 3 in shoulder tendon. The images show an increased collagen type 3 than collagen type 1 expression in Group 1 (representative of 4 individual subjects in Group 1) and Group 2 (representative of 4 individual subjects in Group 2). (B) The ratio of collagen type 1 to type 3. The ratio was calculated using mean fluorescence intensity by ImageJ software from collagen type 1 and type 3 immunofluorescence data. The average intensities of four images taken from different sections of each patients from Group 1 (n = 4) and Group 2 (n = 4) were used for calculation of mean fluorescence intensity. The ratio of collagen type 1 to type 3 is displayed as mean ± SEM of fluorescence intensity (NS—non-significant)

