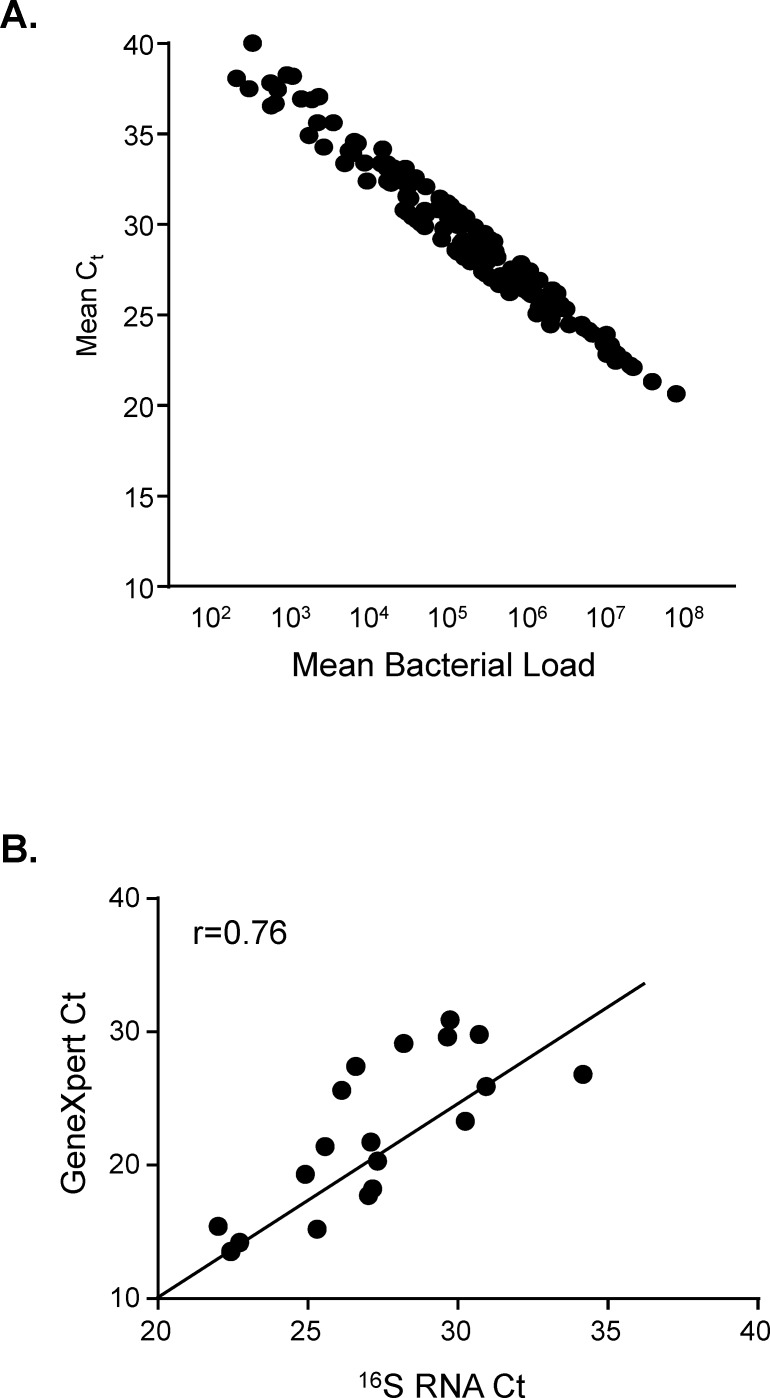
Fig 1. Correlation of bacterial load with cycle threshold values.
RT-PCR was performed in duplicate on RNA extracted from sputum samples of TB patients. A: Log10 bacterial load versus Ct values of Mtb present in sputum pellets. B: Correlation of Ct values from GeneXpert and 16S RNA analysis. Data were analysed using Spearman rank correlation.

