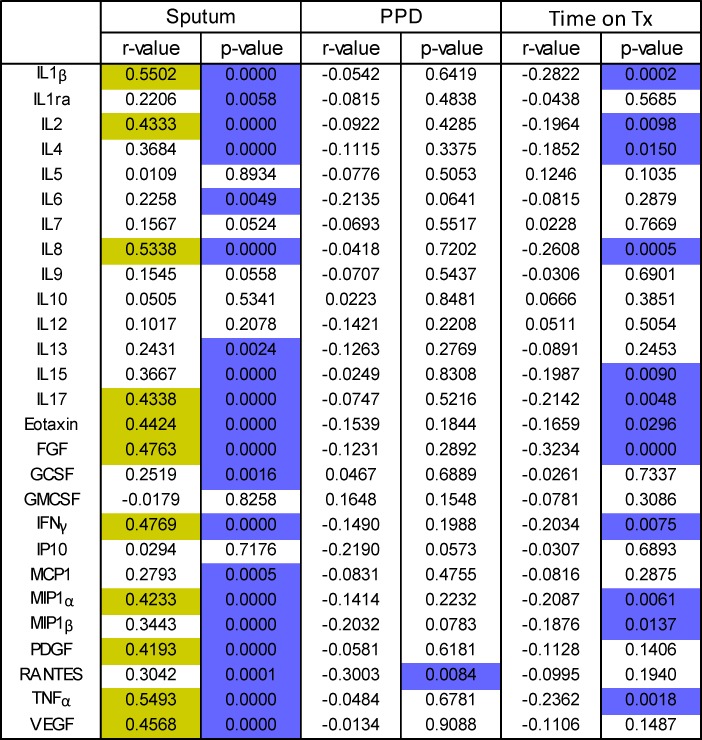
Fig 3. Correlation of MBL and host cytokines in blood and sputum.
Bacterial load was analysed for each sputum sample and correlated with host biomarkers (pg/ml) in the same sputum sample and also in Mtb-stimulated and unstimulated blood using a 27-plex cytokine assay. R-values >0.4 are highlighted in yellow and significant p-values in purple. Data were analysed using a Spearman Rank Correlation. Correlation of Time-on treatment with host biomarkers in sputum was also performed.

