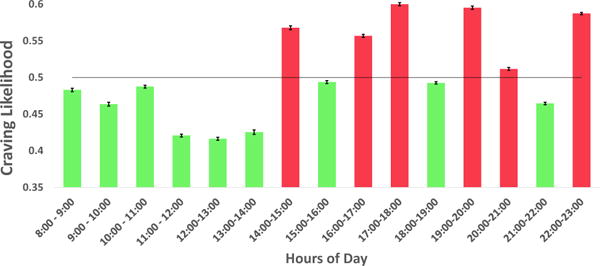
Figure 4.

Craving distribution across hours of a day. Hours with High craving likelihood are marked with red. Hours with Low craving likelihood are marked with green

Craving distribution across hours of a day. Hours with High craving likelihood are marked with red. Hours with Low craving likelihood are marked with green