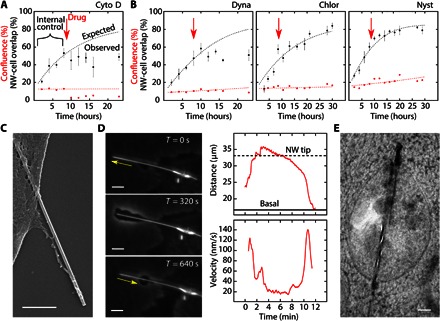
Fig. 4. Mechanistic and morphological studies.

(A) Positive control study of Cyto D (actin inhibitor) showing the SiNW-cell overlap (black dots), cell confluence (red dots), and the expected overlap trend (black line), modeled on the first 8 hours of internalization (internal control) before drug introduction (red arrow). Cell confluence modeled as an exponential fit (red line). (B) Endocytosis inhibitors: dynasore (Dynamin; left), chlorpromazine (Clathrin; middle), and nystatin (Lipid Rafts; right), indicating dynamin’s critical role in SiNW internalization. (C) SEM micrograph showing membrane extension along a SiNW (scale bar, 500 nm). (D) Time-lapse SEPC micrographs of a membrane extending along a SiNW before cellular uptake (left) (scale bar, 5 μm). Distance of the protrusion’s leading edge from the base of the SiNW over time (top right), with the corresponding instantaneous velocities (bottom right). Base membrane and nanowire tip distances given as solid and dotted lines, respectively. Velocities smoothed over an 11-frame interval. (E) TEM micrograph showing a long intercellular SiNW protruding from a vesicle into the cytosol (scale bar, 250 nm).
