
Fig. 5. Quantum oscillation analysis and extraction of the Berry phase in ZrSiS.
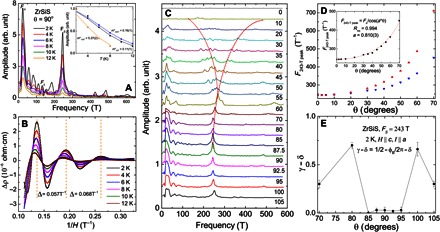
(A) FFT at 90° of the SdH oscillations extracted after subtracting a polynomial background (see the Supplementary Materials). Fα, Fβ, and Fδ denote frequencies at 23, 243, and 130 T, respectively. Extra peaks resulting from F2α, F3α, F4α, and F2β are also visible along with three more unidentified frequencies at 154, 186, 426, and 487 T. The inset shows the LK fit used to determine the effective mass of the electrons for the 23-, 243-, and 130-T peaks. (B) Deconvoluted oscillations pertaining to the Fα. Dashed lines indicate the apparent decay of the period of the oscillation with decreasing field and showcase the temperature-dependent shift of the oscillation’s maxima, making the phase analysis of Fα extremely unreliable. (C) FFT from the extracted oscillations at many different angles of the applied field. Curved lines are guides to the eye to illustrate the peak splitting and shifting occurring as a function of the angle of the applied field. (D) Angular dependence of the Fβ peak. Here, the definition of θ was rotated 90° to allow for easier comparison with other materials; θ= 0 is H parallel to c. Red triangles are the expected values for a truly 2D pocket following the 1/cos(θ) law, inverted blue triangles are the measured values, and a deviation occurs by 20°. The inset shows a fit of the data to F/Bcos(a*θ). (E) Extracted total phase (γ − δ) of Fβ as a function of angle, obtained by fitting the LK formula to the deconvoluted Fβ’s SdH oscillations. See the Supplementary Materials for details.