. 2016 Nov 23;5:e16748. doi: 10.7554/eLife.16748

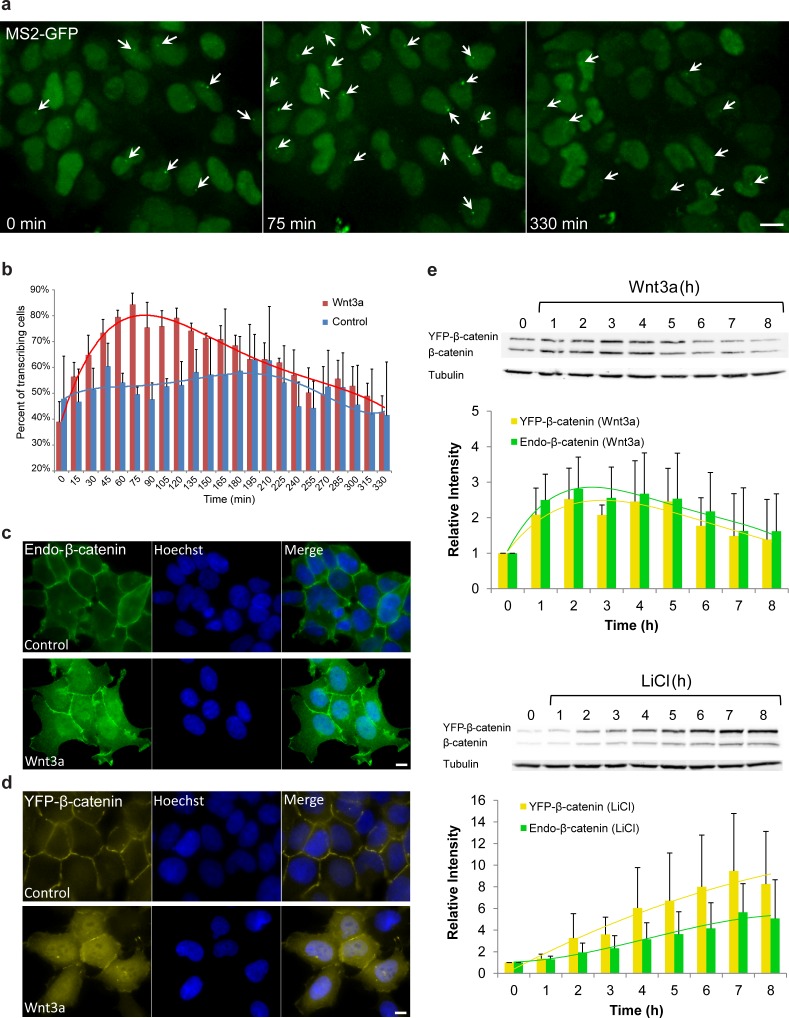
Figure 1. Cell system for following β-catenin intra-cellular dynamics and CCND1 transcription in single living cells.

(a) CCND1-MS2 HEK293 cells stably expressing MS2-GFP-CP were treated with Wnt3a and followed for 6 hr (every 15 min). Several frames from Video 1 are presented. The number of cells exhibiting transcriptionally active CCND1-MS2 genes (green dot in the nucleus, white arrow) was counted over time. Scale bar, 10 µm. (b) Plots showing the percentage of cells in the population with actively transcribing CCND1-MS2 genes in Wnt3a-treated (red, n = 98) and mock treated (blue, n = 128) cells. Mean ± sd from three fields imaged on different days—see Supplementary file 1a for statistics. (c) Immunofluorescence showing that endogenous β-catenin (green) is prominent at the cell membrane in untreated HEK293 cells (top) and accumulates in the cytoplasm and nucleus following activation by Wnt3a for 2 hr (bottom). Hoechst DNA stain is in blue. (d) Similar changes in the subcellular distribution following activation are seen in the YFP-β-catenin low-expressing clone. Bar = 10 μm. (e) Western blot time course of endogenous β-catenin and YFP-β-catenin protein accumulation following either Wnt3a (top) or LiCl (bottom) stimulation. Anti-β-catenin antibody was used for the detection of both β-catenin proteins. Tubulin was used as a loading control. Time 0 is the time point of activator addition. Blots are representative of 3 repeated experiments. The average quantification of 3 repeated experiments is presented in the plots below (mean ± sd). There is no statistical difference between the endogenous and exogenous levels of β-catenin in the two plots.

DOI: http://dx.doi.org/10.7554/eLife.16748.003

Figure 1.

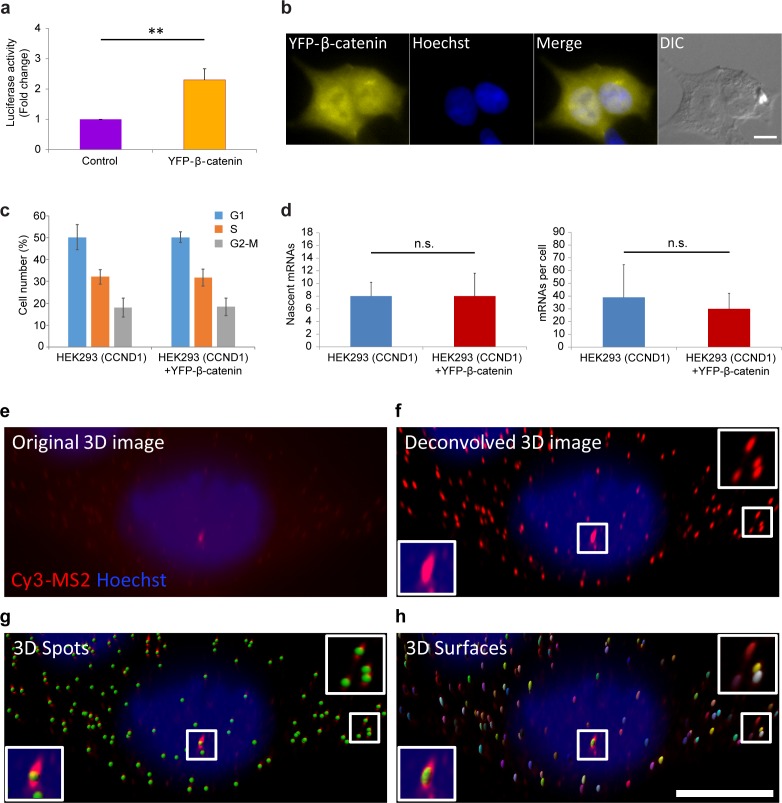
Figure 1—figure supplement 1. Measuring the effect of YFP-β-catenin expression in HEK293 cells.

Figure 1—figure supplement 1.

(a) Luciferase assay showing the levels of cyclin D1 promoter activation following the transient transfection of YFP-β-catenin into HEK293 cells. p=0.003. (b) Overexpression of YFP-β-catenin shows that overexpressed protein localization does not resemble endogenous β-catenin under non-activated conditions, since it is highly present in the nucleus prior to Wnt activation, and does not appear at the membrane. Bar = 10 µm. (c) Cell cycle analysis of HEK293 CCND1-MS2 cells with and without YFP-β-catenin. (d) Quantification of CCND1-MS2 nascent mRNAs (left) (p=0.8) and cellular mRNAs (right) (p=0.16) levels by RNA FISH in HEK293 CCND1-MS2 cell clones with or without YFP-β-catenin (n = 18, n = 26 respectively). **p<0.01, n.s. = p>0.05. (e–h) Example of single molecule mRNA FISH quantification procedure with a probe that hybridizes to the MS2 region in the 3’UTR of the CCND1-MS2 mRNA. (e) Raw 3D image (76 planes in z stack) showing the active transcription site (red) and single mRNA molecules. Hoechst DNA stain is in blue. (f) Deconvolved 3D image. Boxes show the transcription site (bottom) and single cellular mRNAs (top). (g) Identification of ‘spots’ of single mRNAs and transcription site (green dots) by Imaris. (h) Generation of a 3D shell for each spot to be taken for intensity measurements. Bar = 10 µm. Then the sum of intensity at the transcription site was divided by the frequent intensity value of a single mRNA. This ratio provided the number of mRNAs associated with the transcription unit, as explained in the Materials and methods section.