. 2016 Nov 23;5:e16748. doi: 10.7554/eLife.16748

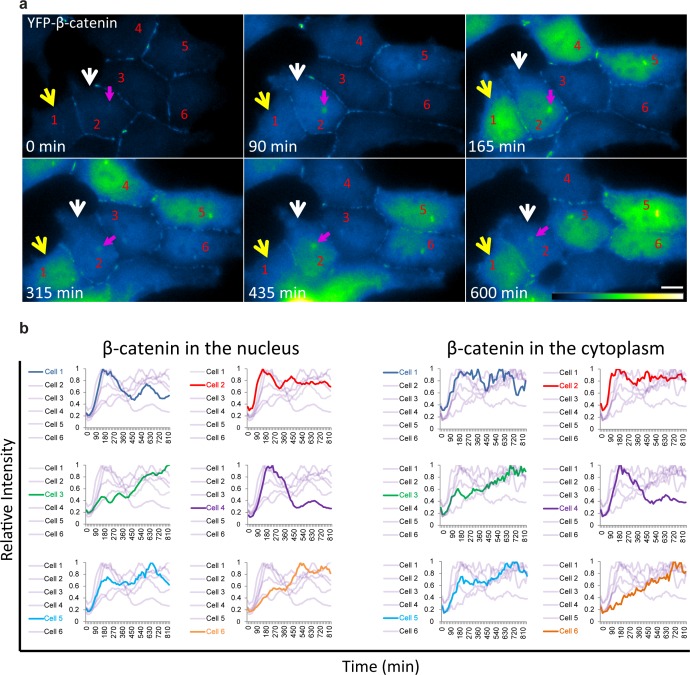
Figure 3. Variability of β-catenin accumulation dynamics following Wnt3a activation in individual cells.

(a) Frames from time-lapse Video 3 showing YFP-β-catenin accumulation in a population of cells. The YFP signal is pseudo-coloured using ImageJ ‘Green Fire Blue’ look-up table. White and yellow arrows point to cells in which β-catenin levels increase and decrease twice during the movie. The pink arrow points to centrosomal accumulation. Bar = 10 μm. (b) β-catenin levels in the nucleus (left) and cytoplasm (right) in individual cells (as numbered in a) are plotted in different colors. The grey background plots show the complete set of plots from all the cells. Maximum β-catenin intensity in each cell was normalized to 1.

DOI: http://dx.doi.org/10.7554/eLife.16748.009

Figure 3.

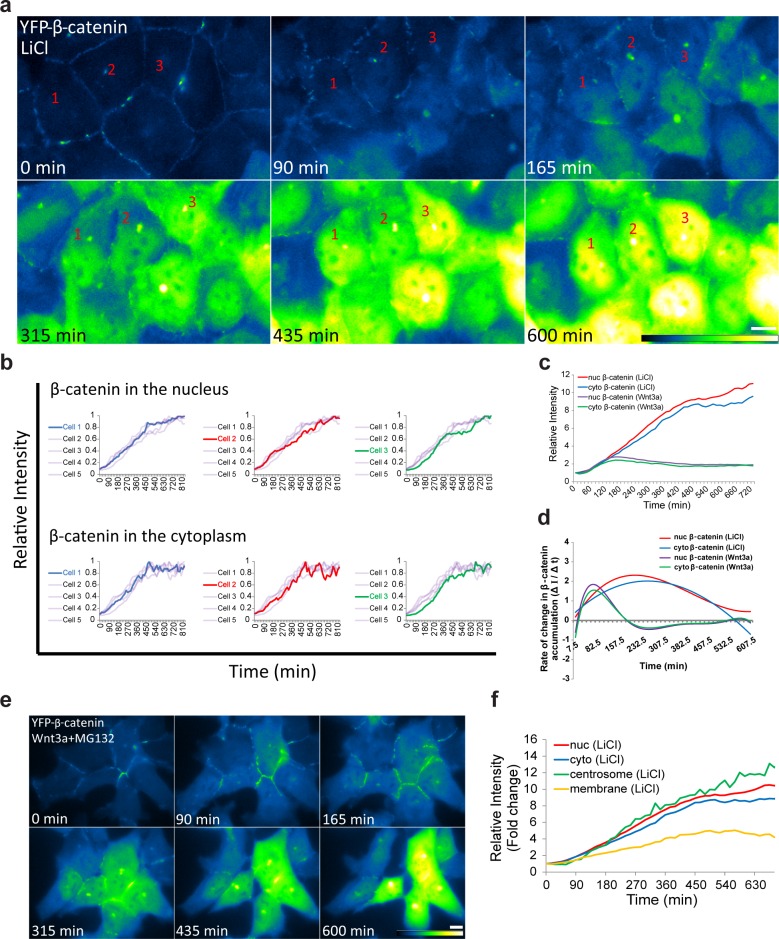
Figure 3—figure supplement 1. β-catenin accumulation dynamics in response to LiCl activation in individual cells.

Figure 3—figure supplement 1.

(a) Frames from time-lapse Video 4 showing YFP-β-catenin accumulation in a population of cells. The YFP signal is pseudo-colored using the ImageJ ‘Green Fire Blue’ look-up table. Bar = 10 μm. (b) β-catenin levels in the nucleus (top) and cytoplasm (bottom) of individual cells (as numbered in a) are plotted in different colors. The grey background plots show the complete set of plots from all the cells. The maximum intensity of β-catenin in each cell was normalized to 1. (c) The relative average intensity of β-catenin measured in the cytoplasm (n = 17) and nucleus (n = 18) of individual cells treated with LiCl for 12 hr, compared to Wnt3a-treated cells (from Figure 2). (d) The rate of change in β-catenin levels (ΔI/Δt) accumulation or degradation in the cytoplasm and nucleus over time in cells from c. (e) Frames from a time-lapse movie showing YFP-β-catenin accumulation in a population of Wnt3a+MG132-treated cells. The YFP signal is pseudo-colored using the ImageJ ‘Green Fire Blue’ look-up table. Bar = 10 μm. (f) The relative average intensity of β-catenin measured in the centrosome, membrane, cytoplasm and nucleus of LiCl-treated cells.
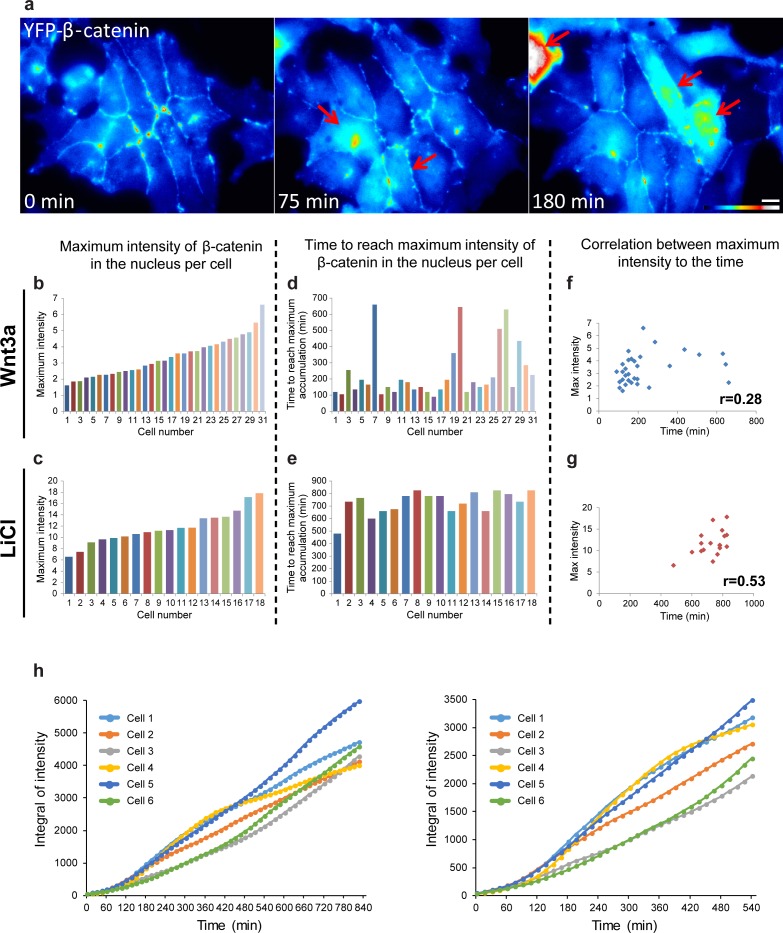
Figure 3—figure supplement 2. The relationship between YFP-β-catenin levels of accumulation and time of Wnt3a activation.

Figure 3—figure supplement 2.

(a) Frames from a time-lapse movie showing YFP-β-catenin accumulation in a population of cells in the field. The YFP signal is pseudo-colored using the ImageJ ‘Royal’ look-up table. Red arrows point to cells with very high β-catenin levels. Bar = 10 μm. Plots showing the relative maximal levels of β-catenin measured in the nuclei of (b) Wnt3a-treated (n = 31) or (c) LiCl-treated cells (n = 18). Order of cells is according to increasing relative intensities. Plots showing the time from the addition of the activator until reaching the maximal levels of β-catenin in the same set of (d) Wnt3a-treated or (e) LiCl-treated cells. (f,g) The respective correlation plots and scores for a Pearson correlation analysis between the maximum intensity in each cell and the time to reach the highest accumulation. (h) The integral of the fluorescence values in the six cells (from Figure 3) showing the total accumulation levels over time during the whole observation period (left). The right-hand plot shows the differences between accumulation in the cells at earlier times.