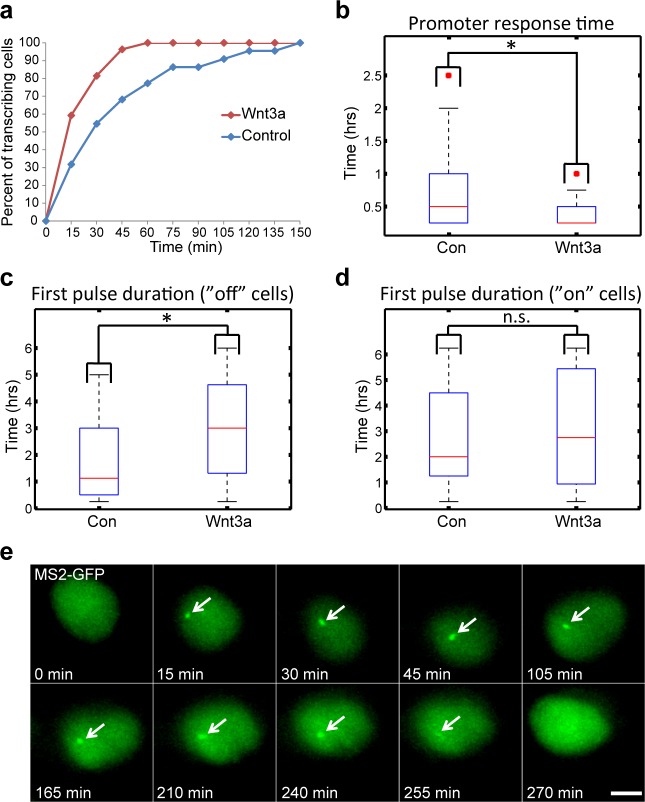
Figure 7. Measuring the transcriptional response of CCND1-MS2 to Wnt3a activation in living cells.
(a) The percentage of cells in a population of either mock-treated (blue) or Wnt3a-activated cells (red) showing an active CCND1-MS2 transcribing gene, over time. (b) The promoter response time of CCND1-MS2 activation from the addition of Wnt3a (n = 27) or in mock-treated conditions (n = 22). In the boxplots, the median is indicated by a red line, the box represents the interquartile range, the whiskers represent the maximum and minimum values, and red dots represent outliers. (p=0.01). (c,d) Periods of gene activity measured in mock-treated and Wnt3a-treated cells. The population was divided into cases where the gene was either not transcribing before the addition of Wnt3a or mock-treatment (‘off’, n(Wnt3a) = 27, n(Con) = 22, p=0.01) or if the gene was already active (‘on’, n(Wnt3a) = 37, n(Con) = 52, p=0.77). *p<0.05, n.s. = p>0.05. (e) Frames from Video 12 showing the activation of the CCND1-MS2 gene detected by MS2-GFP mRNA tagging (arrow) following Wnt3a treatment. Bar = 10 µm.


