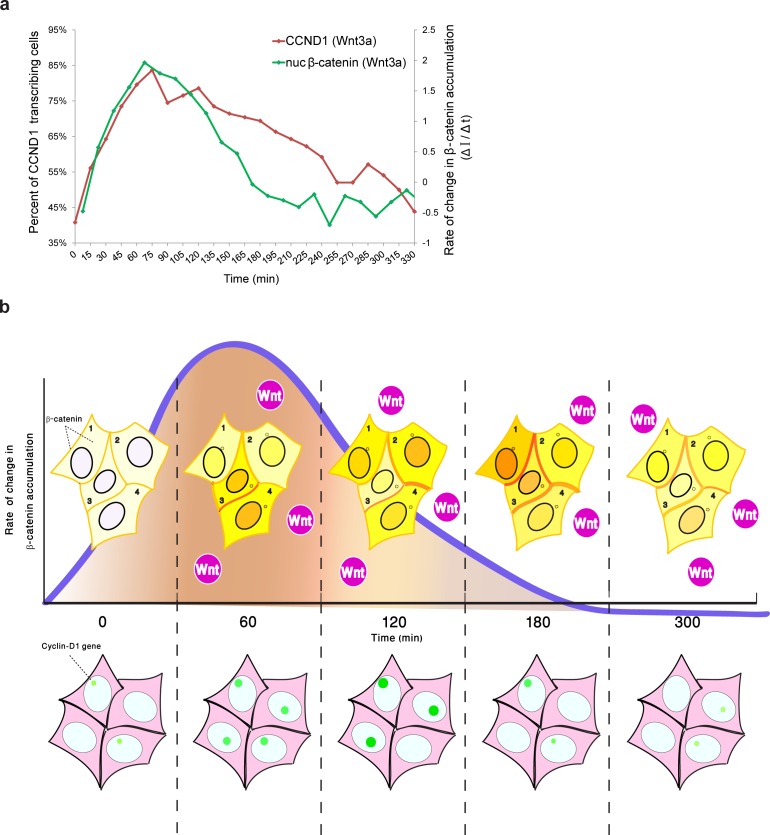
Figure 9. Comparing the kinetics of CCND1 transcriptional activation to the dynamics of β-catenin nuclear accumulation rate of change following Wnt signaling in living cells.
(a) Plots of the average transcriptional activation kinetics of CCND1-MS2 (red) following Wnt3a activation, compared to the plot of rate of change in β-catenin nuclear accumulation (green). (b) Scheme of the dynamic changes occurring in the studied cell system following Wnt signaling. Top - from left to right: Levels of β-catenin (yellow) in the nucleus are normally low but after the addition of Wnt3a to the medium a significant and rapid increase in the nucleus is observed, peaking after 2–3 hr. β-catenin levels later decline in the nucleus and cytoplasm due to degradation. While this is the average behavior in the population (e.g. cells 1 and 2), when examining individual cells, different dynamics such as multiple pulsations (e.g. cell 3) and rapid initial accumulation (e.g. cell 4) are observed. β-catenin levels increase simultaneously at the membrane and at the centrosome. Bottom- β-catenin induces cyclin D1 transcriptional activity (green dot), and modulation of the transcriptional reaction can be observed as the gene reaches higher levels of activity, for longer periods of time. The rate of change in β-catenin accumulation (blue curve, top), rather than the actual levels of β-catenin in the nucleus, correlate with the kinetics of transcriptional activation.

