. 2016 Nov 25;5:e19571. doi: 10.7554/eLife.19571

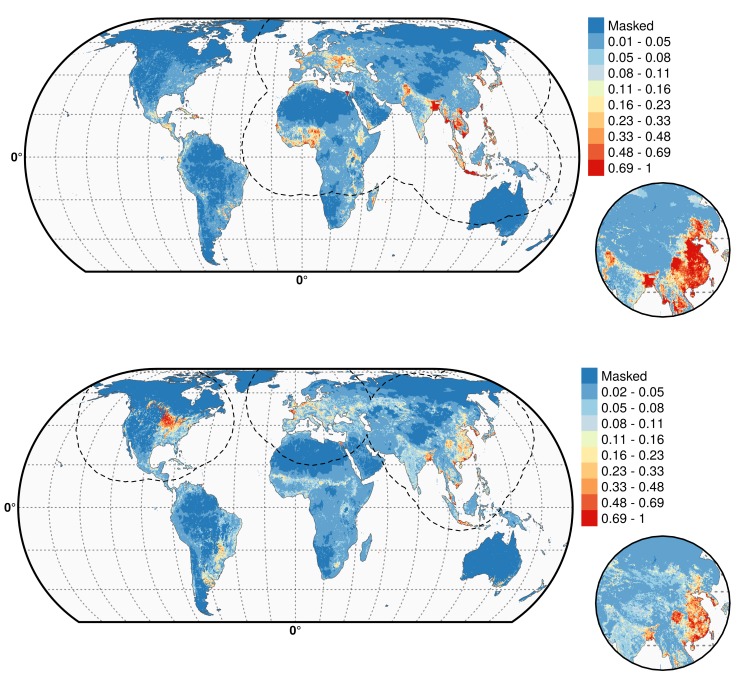
Figure 4. Predicted probability of occurrence of HPAI H5N1 and H5Nx clade 2.3.4.4.

Predicted probability of occurrence of HPAI H5N1 for the Set 1 (top) and of H5Nx clade 2.3.4.4 for the Set 4 (bottom) (Figure 4—source data 1 and 2 respectively). The dashed black line represents a buffer around the occurrence data for the HPAI H5N1 and H5Nx clade 2.3.4.4 predictions, corresponding to an area from which pseudo-absences were selected. The circle inset shows the prediction obtained when the effect of the variable IsChina was removed. The suitability maps HPAI H5N1 and H5Nx clade 2.3.4.4 for Set 2 and Set 3 variables are presented in Figure 4—figure supplement 1 and Figure 4—figure supplement 2 , respectively. The shapefile data used to produce these maps were all from public sources (http://www.naturalearthdata.com/). The graticule is composed of a 20-degree increments and the coordinate system is Eckert IV (EPSG: 54012). This figure was built with the R-3.2.4 software (https://cran.r-project.org/). Additionally, Figure 4—figure supplement 3 depicts the Multivariate environmental similarity surfaces (MESS) maps for HPAI H5N1 and H5Nx clade 2.3.4.4 for the four sets of predictor variables.

DOI: http://dx.doi.org/10.7554/eLife.19571.009

Figure 4—source data 1. Suitability predictions for the HPAI H5N1 best model (GeoTiff format).
DOI: 10.7554/eLife.19571.010
Figure 4—source data 2. Suitability predictions for the H5Nx clade 2.3.4.4 best model (GeoTiff format).
DOI: 10.7554/eLife.19571.011

Figure 4.

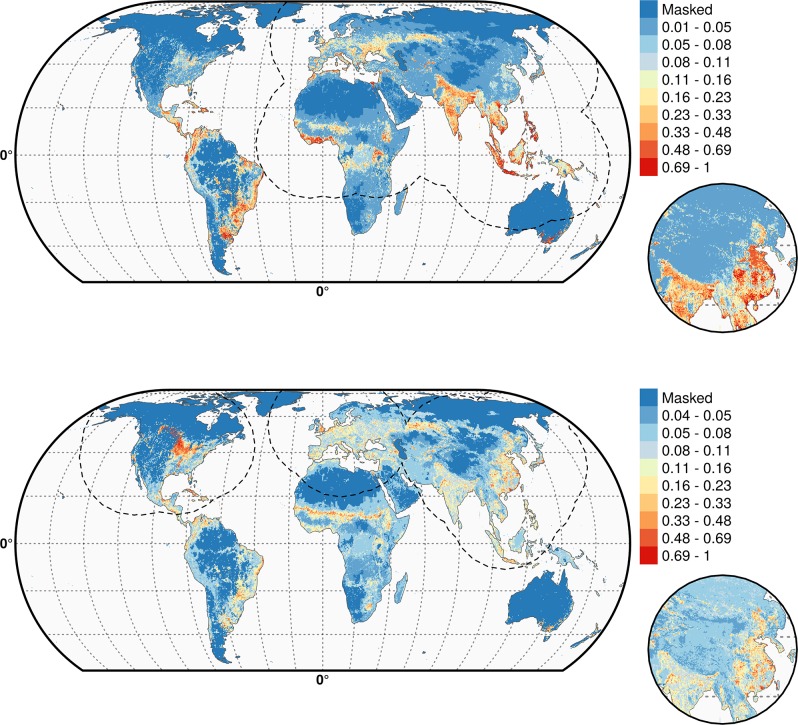
Figure 4—figure supplement 1. Predicted probability of occurrence of HPAI H5N1 (top) and of H5Nx clade 2.3.4.4 (bottom) for the Set 2 variables.

Figure 4—figure supplement 1.

The dashed black line represents a buffer around the occurrence data for the HPAI H5N1 and H5Nx clade 2.3.4.4 predictions, corresponding to an area from which pseudo-absences were selected. This figure was built with the R-3.2.4 software (https://cran.r-project.org/). The shapefile data used to produce these maps were all from public sources. (http://www.naturalearthdata.com/). The graticule is composed of a 20-degree increments and the coordinate system is Eckert IV (EPSG: 54012).

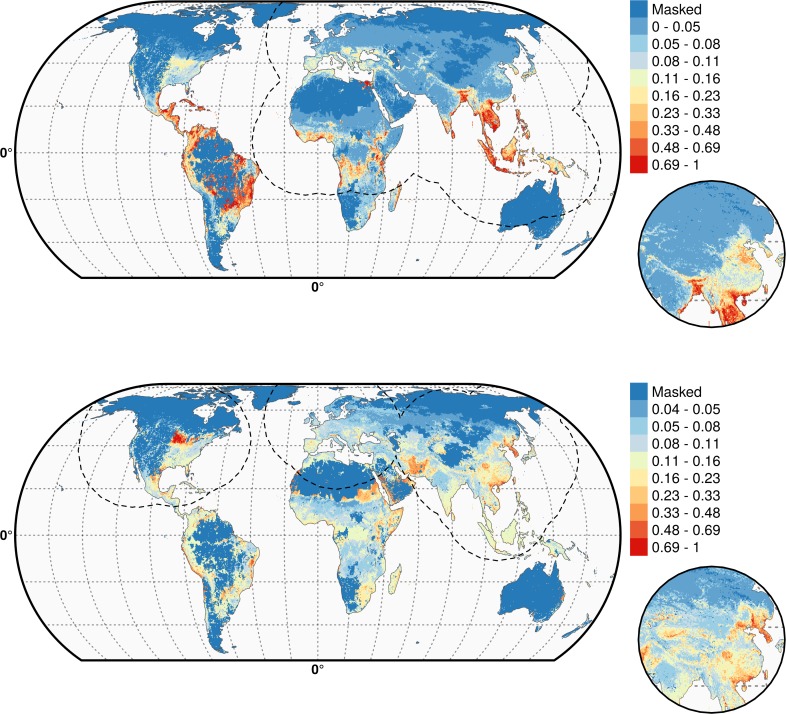
Figure 4—figure supplement 2. Predicted probability of occurrence of HPAI H5N1 (top) and of H5Nx clade 2.3.4.4 (bottom) for the Set 3 variables.

Figure 4—figure supplement 2.

Predicted probability of occurrence of HPAI H5N1 (top) and of H5Nx clade 2.3.4.4 (bottom) for the Set 3 variables. The dashed black line represents a buffer around the occurrence data for the HPAI H5N1 and H5Nx clade 2.3.4.4 predictions, corresponding to an area from which pseudo-absences were selected.. This figure was built with the R-3.2.4 software (https://cran.r-project.org/).The shapefile data used to produce these maps were all from public sources (http://www.naturalearthdata.com/). The graticule is composed of a 20-degree increments and the coordinate system is Eckert IV (EPSG: 54012).

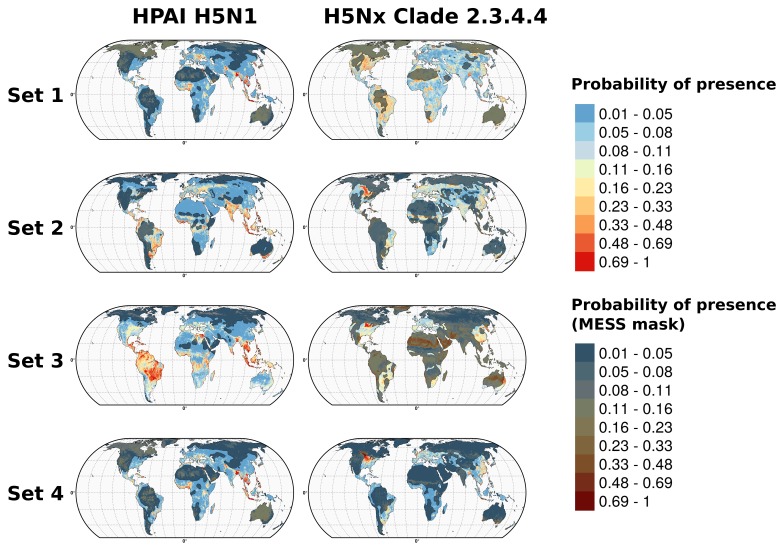
Figure 4—figure supplement 3. Multivariate environmental similarity surfaces (MESS) maps for HPAI H5N1 and H5Nx clade 2.3.4.4.

Figure 4—figure supplement 3.

Predicted probability of occurrence of HPAI H5N1 and of H5Nx clade 2.3.4.4 for the different sets of predictors, with the Multivariate environmental similarity surfaces (MESS) mask. The MESS mask covers areas that had predictor variables outside of the range of the predictor variable values in the occurrence points, as quantified by a negative MESS similarity index.