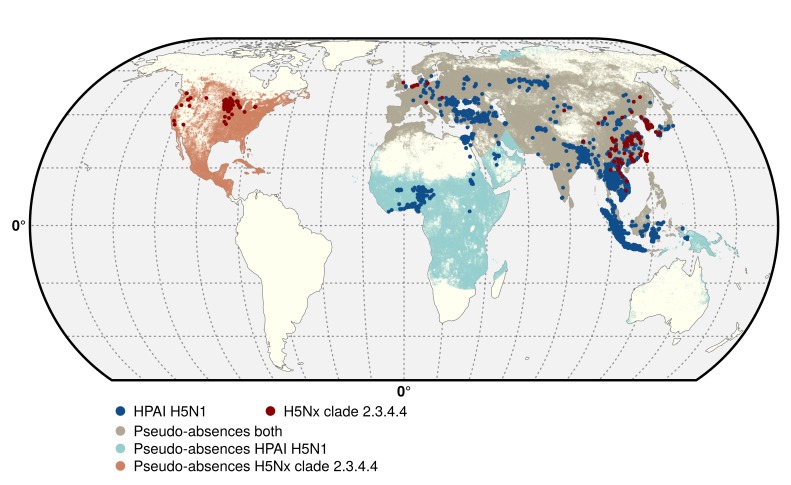
Figure 5. Geographic distribution of presence and pseudo-absences of HPAI H5N1 and HPAI H5Nx clade 2.3.4.4.
Geographic distribution of presence points of HPAI H5N1 (blue) and HPAI H5Nx clade 2.3.4.4 (red). The pseudo-absences are represented in light blue, light red and light brown. This figure was built with the R-3.2.4 software (https://cran.r-project.org/). The shapefile data used to produce these maps were all from public sources (http://www.naturalearthdata.com/). The graticule is composed of a 20-degree increments and the coordinate system is 'EPSG: 54012'.

