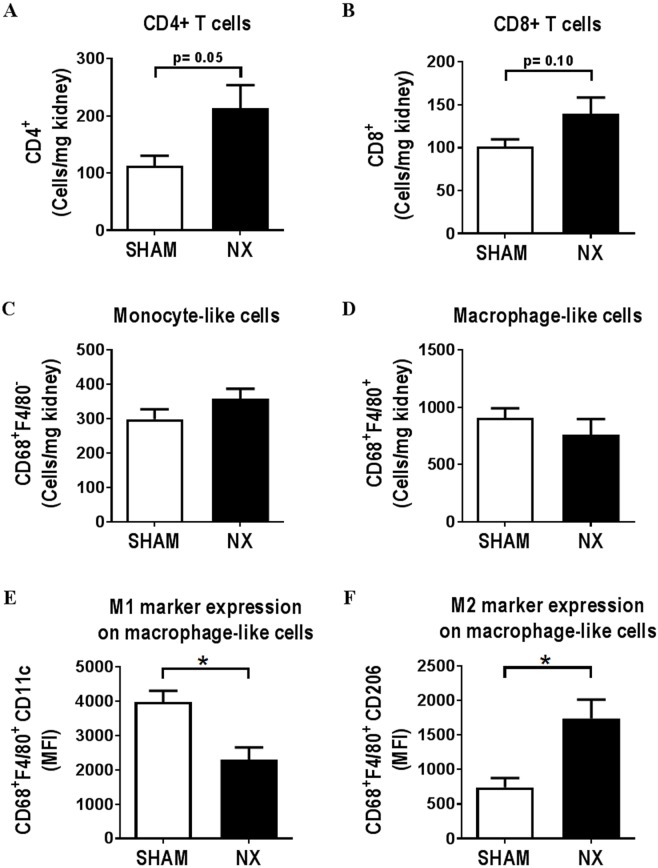
Fig 2. Immune cell composition is changed in kidneys from uremic LDLr-/- mice.
Sixteen weeks after induction of uremia, flow cytometry was performed on kidneys from control (SHAM) and uremic (NX) LDLr-/- mice (n = 5 mice/group). The number of CD4+ T-cells (A), CD8+ T-cells (B), monocyte-like (CD68+F4/80-) and macrophage-like (CD68+F4/80+) cells (C and D) relative to kidney weight is depicted. On macrophage-like cells, median fluorescent intensity (MFI) for the M1 marker CD11c (E) or the M2 marker CD206 (F) was detected. Depicted values are mean±SEM. *p<0.05 as determined by unpaired students t-test.

