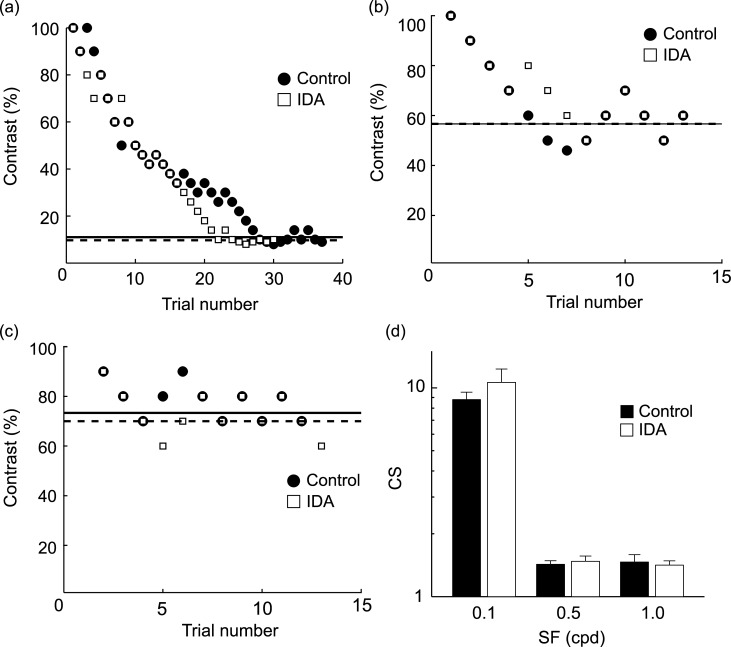
Fig 2. Effects on performance in the 2AFC task by IDA.
The format of this figure is identical to that of Fig 1. (a)-(c) Black circles, Control; white squares, IDA. (d) Population data (n = 7) of CS obtained at three different SFs. There was no significant difference between the two conditions at any SF (SF 0.1: P = 0.21, SF 0.5: P = 0.52, SF 1.0: P = 0.47, paired t-test). Error bars are SEM.

