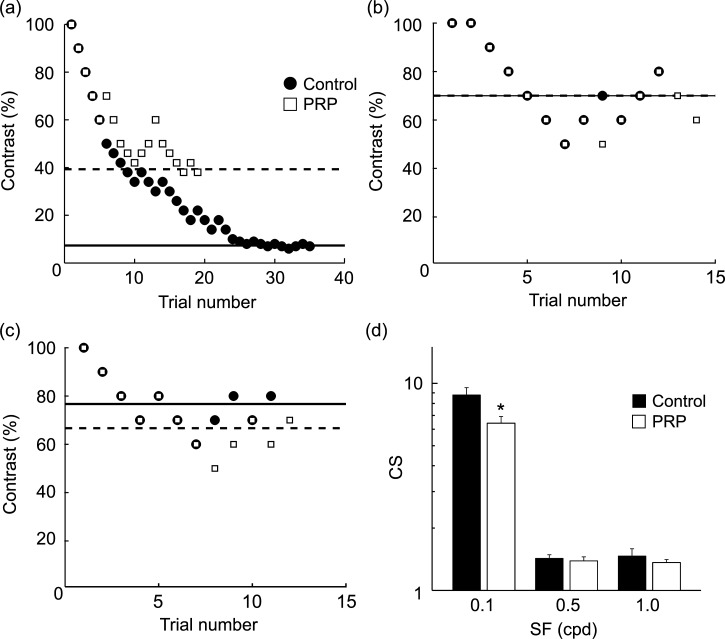
Fig 3. Effects on performance in 2AFC task by PRP.
The format of this figure is identical to that of Fig 1. (a)-(c) Black circles, Control; white squares, PRP. Cthreshold at optimal SF (a) was 7.3% for control (Solid horizontal line) and 39.3% for PRP (dotted horizontal line). (d) Population data (n = 7) of CS significantly decreased in the PRP condition at optimal SF (*P<0.05, paired t-test) but not at limited SFs (SF 0.5: P = 0.85, SF 1.0: P = 0.47, paired t-test). Error bars are SEM.

