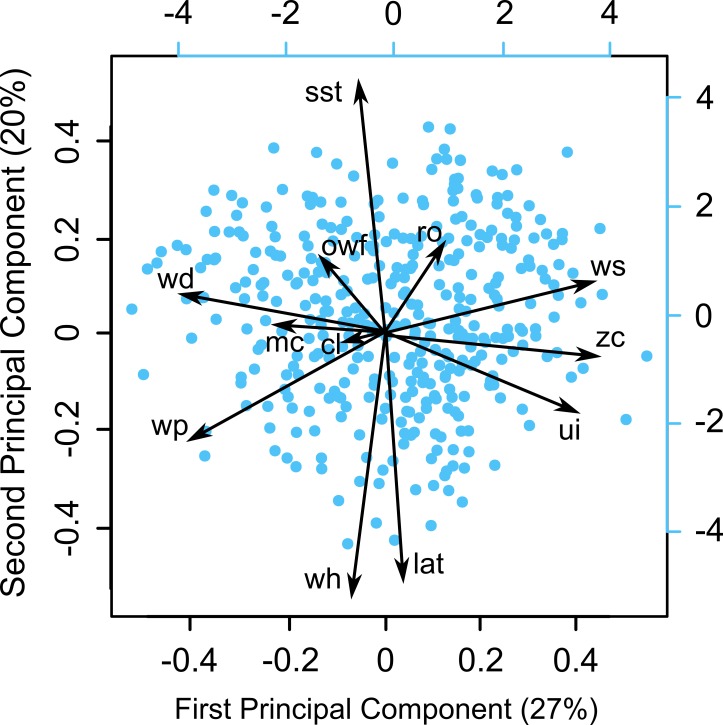
Fig 2. Principal Component Analysis demonstrating the relationship of the predictor variables.
Dots indicate observations. Abbreviations indicate: chlorophyll-a concentrations (cl), latitude (lat), meridional currents (mc), onshore wind frequency (owf), river outflow (ro), sea surface temperature (sst), upwelling index (ui), wave height (wh), wave period (wp), wind direction (wd), wind speed (ws), and zonal currents (zc).

