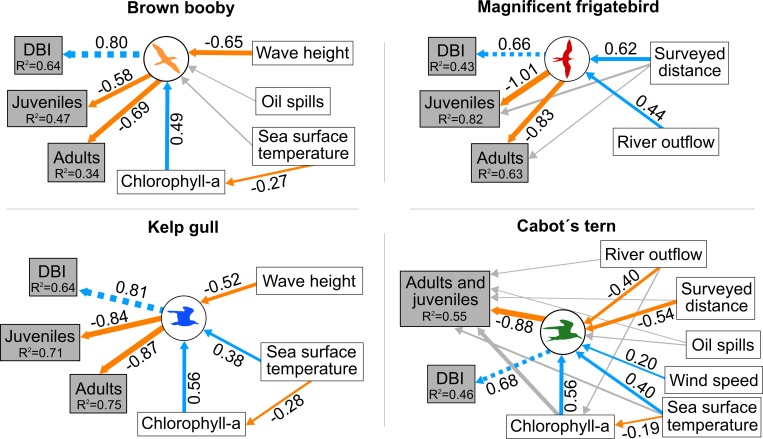
Fig 4. Best-fitting Structural Equation Models (SEMs) for stranding seabird wrecks in Brazil.
Predictor variables are shown in white boxes, while the composite terms are shown in the circles. Response variables included in the composite term are displayed in grey boxes. Significant paths (P < 0.05) are presented in blue (positive effects) and in orange (negative effects). Non-significant paths (P > 0.05) are shown in grey. Numbers adjacent to arrows indicate path coefficient estimates. The larger the coefficient, the greater the magnitude of the relationship between the variables. The width of the arrows is proportional to the value of the standardized coefficients (comparable to each other). The model fit the data (S4 Table). The variance explained by the model (R2) is shown next to each response variable.

