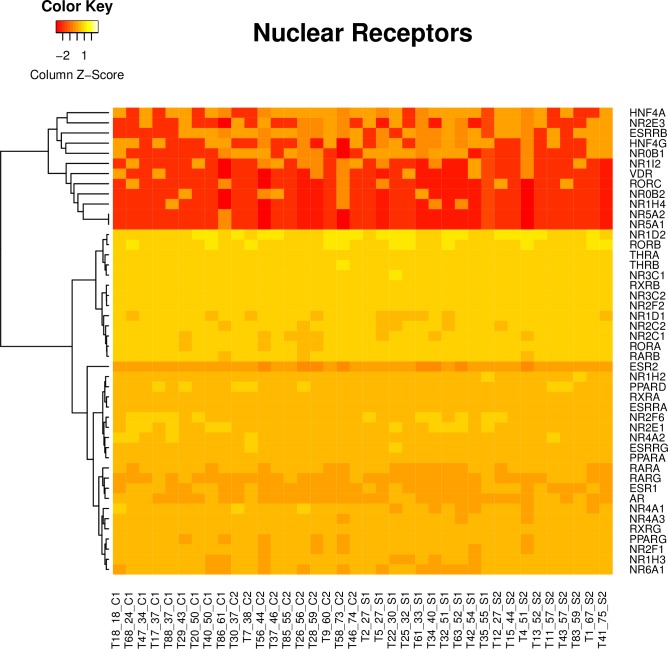
Fig 1. Hierarchical clustering of the NR genes, according to their expression.
Heatmap from hierarchal clustering of the NR genes in all samples (19 schizophrenia samples and 19 controls), produced using the heatmap.2 function of the gplots package in R. The samples (controls and schizophrenia) are on the x-axis and the genes are on the y-axis. The CPM values produced by edgeR were adjusted by firstly dividing by the gene length, they were then log2 transformed. The rows (gene names) are clustered and the genes re-ordered (Rowv = T, Colv = F, scale = “column”) resulting in 3 clusters (lowly expressed genes: red, moderately expressed genes: orange, highly expressed genes: yellow).

