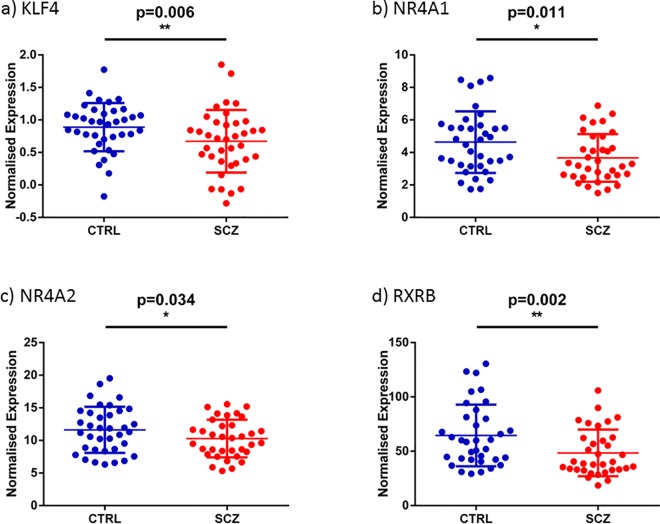
Fig 2. Diagnostic difference of nuclear receptors and KLF4.
Graphs show the distribution of gene expression of a) KLF4 b) NR4A1 c) NR4A2 and d) RXRB normalized by the geomean of four housekeeper genes. Blue circles represent individual 37 control samples, and red circles represent the individual 37 schizophrenia samples, all showing mean and standard error of mean (SEM). * represents significance.

