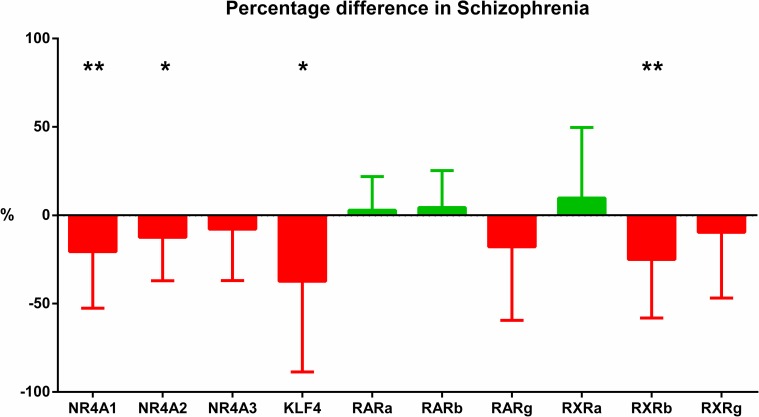
Fig 3. Percentage difference in expression of genes.
Overview of the percentage change of NR4A1, NR4A2, NR4A3, KLF4, RARA, RARB, RARG, RXRA, RXRB, and RXRG normalized expressions compared to controls. Red bars indicate the percentage decrease, green bars indicate the percentage increase, all showing standard error of mean (SEM). * represents significance.

