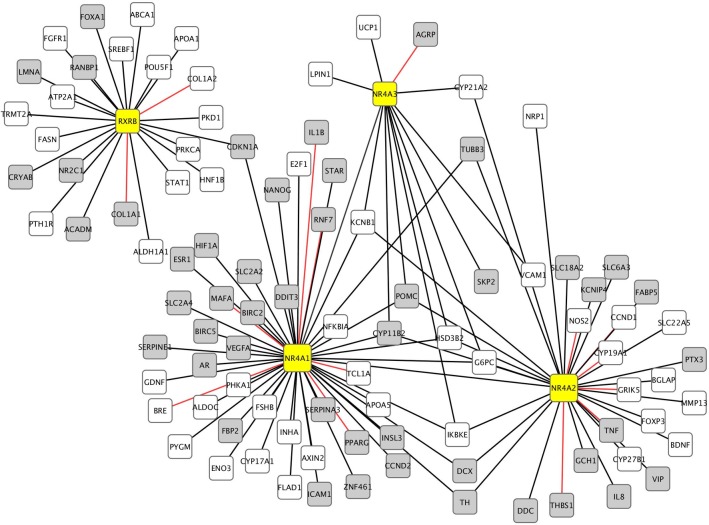
Fig 5. Network map of genes transcriptionally regulated by the NR4A family and RXRB.
The Metacore database was used to generate lists of genes transcriptionally activated or inhibited by NR4A1, NR4A2, NR4A3, and RXRB as supported by experimental evidence. The interactions were mapped using Cytoscape. Black lines represent transcriptional activation, red lines represents transcriptional inhibition. The color of the node reflects the trend in expression change in schizophrenia, white (relative decrease in schizophrenia) and grey (relative increase in schizophrenia). It should be noted that these changes may not have reached statistical significance after multiple testing correction.

