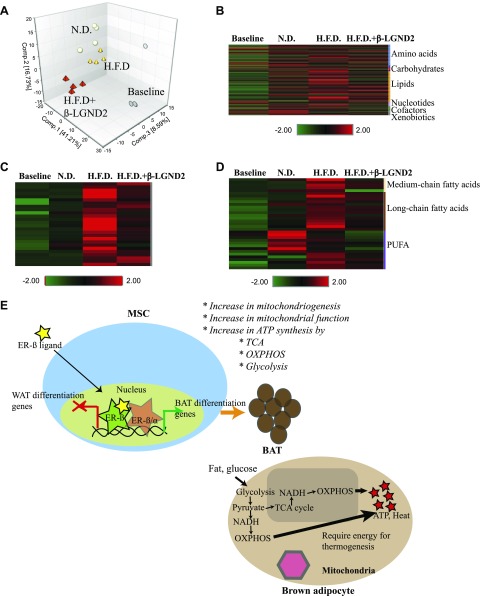
Figure 6.
Age-related changes in serum metabolites in lean and obese mice. Metabolites were identified in serum of animals (n = 4 per group) shown in Fig. 1B. Serum was isolated from blood at euthanasia, and metabolites were identified. Baseline samples (n = 4) were also obtained before initiation of experiment for comparison with end-of-experiment samples. A) PCA shows clustering of individual samples. B) Serum metabolites are represented as heat map. C, D) Pathway-specific metabolites belonging to sphingolipid (C) and fatty acid (D) metabolism are represented as heat maps. E) Model for action of ER-β in adipocytes.

