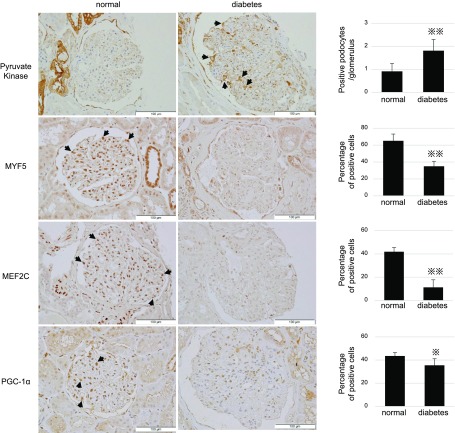
Figure 5.
Representative images of immunostaining of kidney-biopsied specimens from normal participants and patients with diabetic nephropathy. Arrows indicate positive podocytes. Percentages of positive cells for PGC-1a, MYF5, and MEF2 per total cells in glomeruli were calculated. For pyruvate kinase, numbers of positive podocytes per glomerulus were counted. *P < 0.05, **P < 0.01, unpaired Student's t test.

