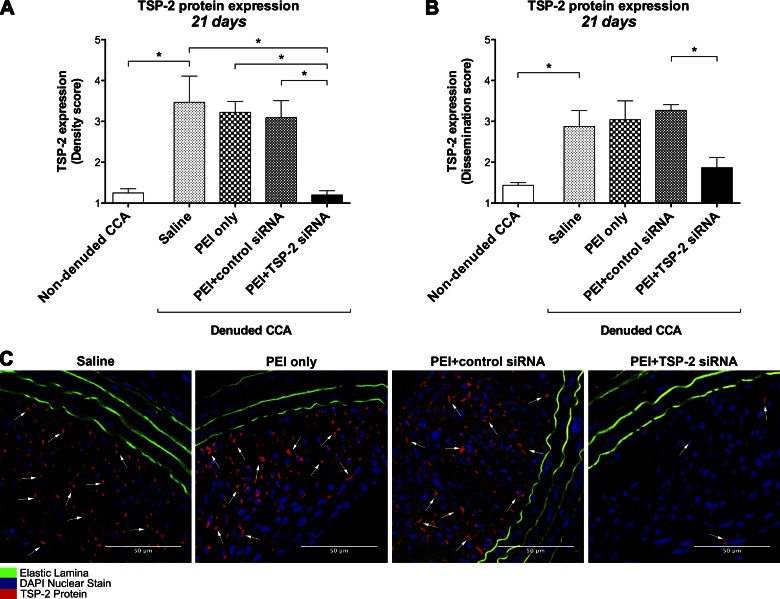
Figure 2.
TSP-2 protein expression. A, B) Quantification of TSP-2 protein expression in all groups at 21 d on the basis of density (A) and dissemination scores (B). Data are expressed as arbitrary scores (1–5) and presented as means ± sem; n = 4. C) Representative images at 21 d of all denuded CCA stained for TSP-2 protein (red), nuclei (blue), and elastic lamina (green autofluorescence). Original magnification, ×400. Scale bars, 50 μm. *P < 0.05.

