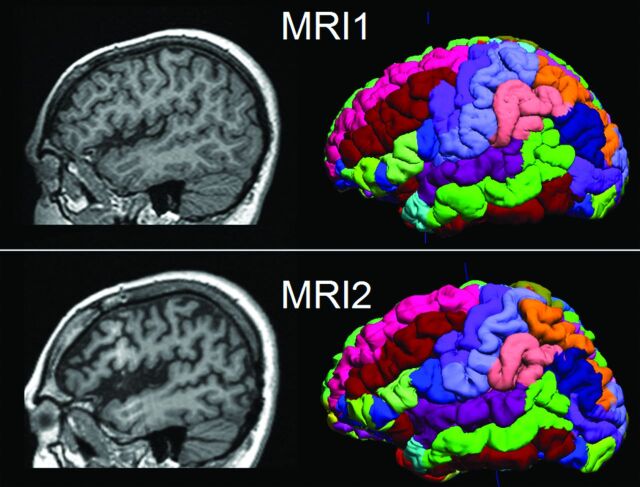
Fig 1.
Illustration of 2 serial MRIs from the same patient (P6) and the SVReg output of BrainSuite. First row: MR imaging at 10 years of age. Second row: MR imaging at 17 years of age. Shown in the left column are the sagittal T1-weighted MPRAGE images. The right column is the cortical rendering of the SVReg labels, with different colors denoting different anatomic areas of the brain. Pronounced atrophy can be observed at the left peri-Sylvian area, and HRvol shows a decrease from 0.79 to 0.70.

