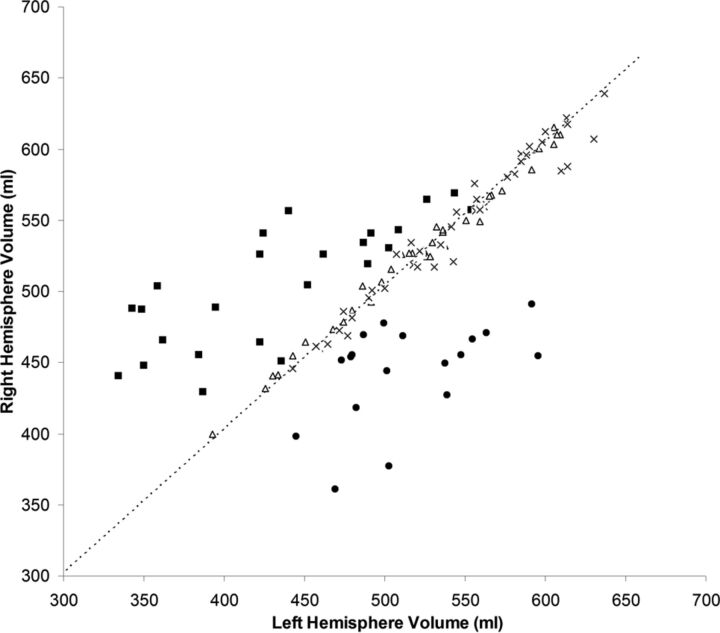
Fig 2.
Absolute volume of the right hemisphere versus volume of the left hemisphere in patients with RE and 2 control groups. Triangles indicate healthy controls; crosses, controls with non-RE epilepsy; squares, patients with left RE; and circles, patients with right RE. The dashed line is the diagonal line representing hemispheres with equal volumes.

