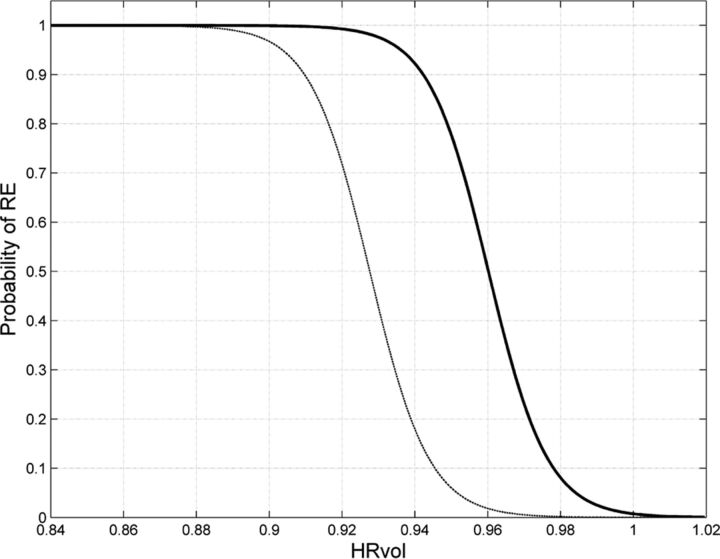
Fig 6.
Probability curves depicting the relationship between HRvol and the probability of RE. The solid curve was estimated on the basis of comparison of 42 scans from patients with RE and 42 scans from controls with non-RE epilepsy with the same disease duration. The thin dashed curve was additionally generated to correct for the difference in incidence of RE and non-RE epilepsy (1 in 1,000,000 versus 1 in 100).

