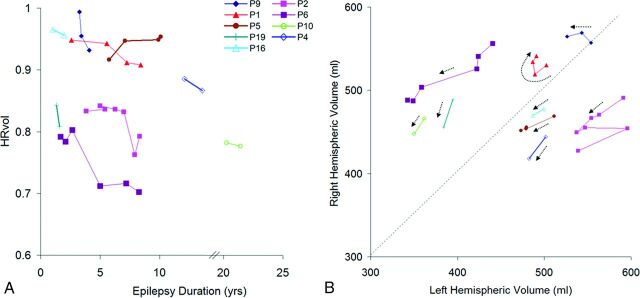
Fig 7.
A, HRvol plotted over epilepsy duration in the 9 patients with serial MR imaging. All except P5 show a decrease in HRvol for the observed time. The axis is broken from 14 to 20 years because there are no data points for these durations. B, Absolute hemispheric volume (right-sided versus left-sided plots) of the same 9 patients. The direction of each dotted arrow shows the progression of disease over time in each patient. A and B share the same symbol for each patient for direct comparison.

