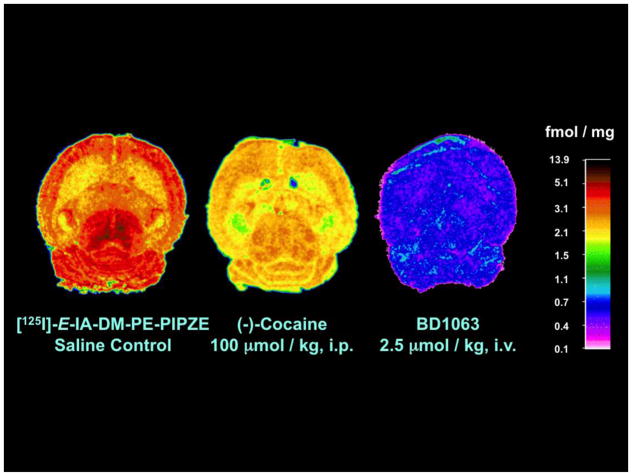
Fig. 19.
Visualization of σ1 receptors in horizontal sections (20 μm) from CD-1® mouse brain 60 min after administration of [125I]-E-IA-DM-PE-PIPZE (150 μCi, i.v.). Left image: Total binding, saline-treated control. Center image: Reduced binding in the presence of (−)-cocaine (100 μmol / kg, i.p.). Right image: Non-specific binding defined by BD1063 (2.5 μmol / kg, i.v.). Calibrated pseudo-color palette (fmol / mg tissue) is shown on the far right. Figure and legend adapted, with permission, from [58].

