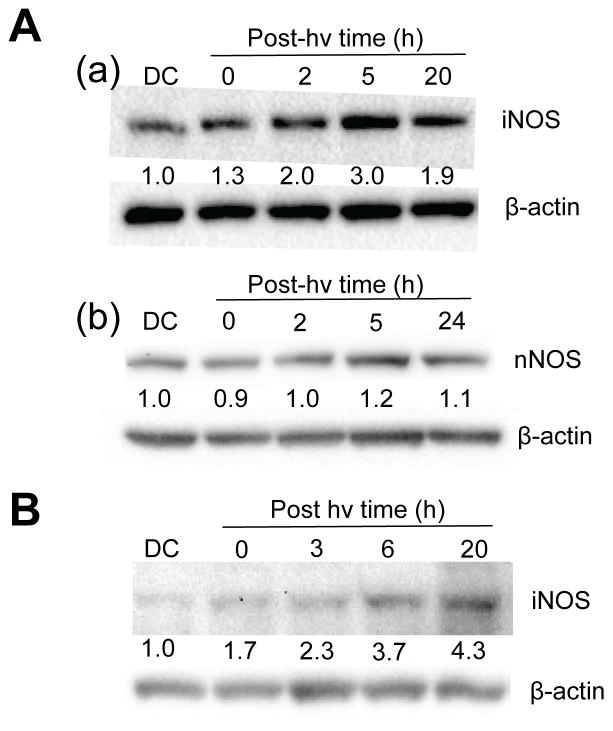
Figure 4.
Western blots of iNOS and nNOS in glioblastoma cells after a photodynamic challenge. (A) ALA-treated U87 cells were irradiated (1 J/cm2), switched from serum-free to 1% serum-containing medium and at the indicated post-irradiation times, subjected to Western analysis for iNOS (a) or nNOS (b). A 20 h dark control (DC) was also analyzed. (B) ALA-treated U251 cells were irradiated similarly to U87 and Western-analyzed for iNOS at the indicated post-irradiation times. Intensity relative to β-actin and normalized to DC is indicated below each NOS band in (A) and (B).

