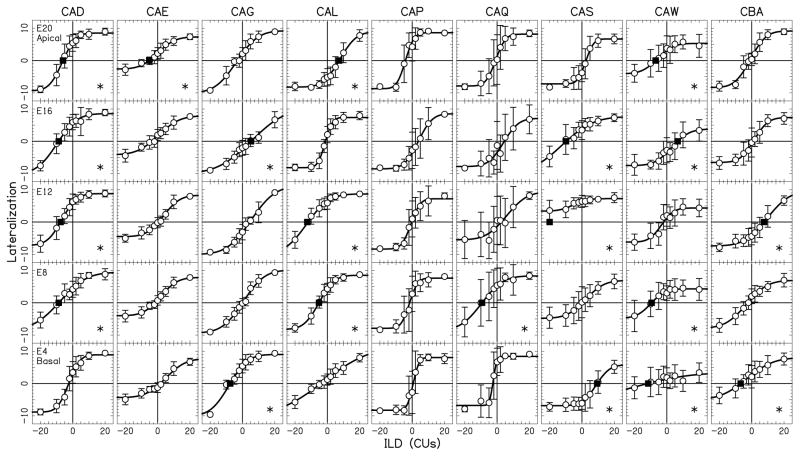
Figure 3.
Lateralization data as a function of ILD on single electrode pairs 20, 16, 12, 8, and 4. Individual listeners are shown in different columns, while the rows show the data for each of the electrode pairs. Scale on y-axis is the lateralization response, from the left-most response (-10) to the right-most response (10). Open circle symbols represent the average response at each ILD and error bars show ±1 standard deviation over the 20 trials. Solid curved lines are cumulative Gaussian fits to the average data. Asterisks in the right low corner of the panels indicate the pairs with a ≥5 CUs bias magnitude at 0-CU ILD. Filled squares symbols show the bias values ≥5 CUs, which were derived as the x-axis (middle line) intersection point of the lateralization curves.

