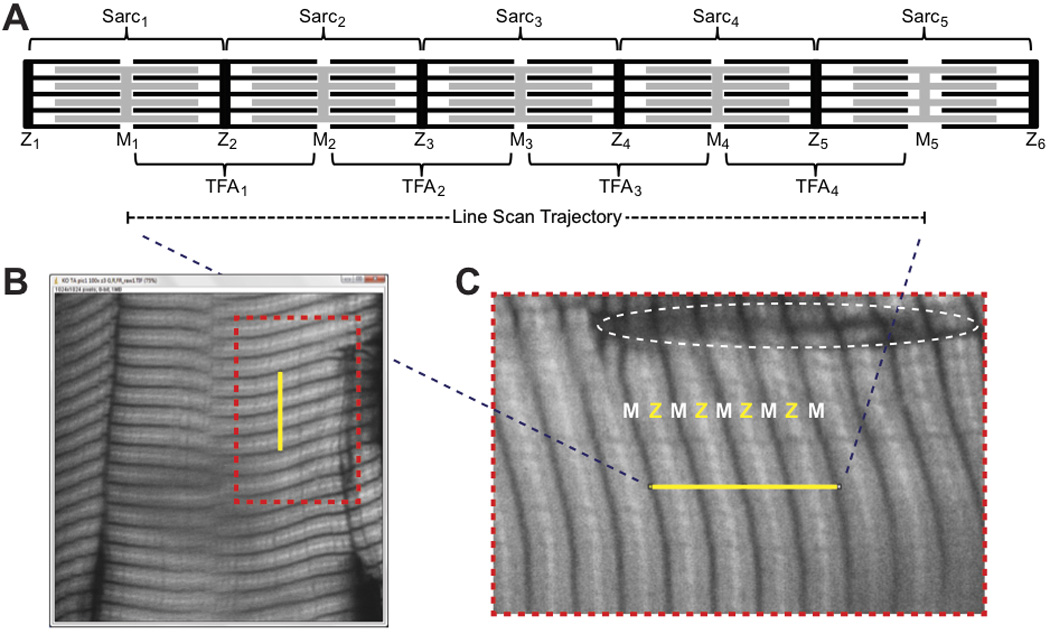
Figure 2. Sample image of phalloidin-stained mouse skeletal muscle and corresponding line scan trajectory.

(A) Schematic of striated myofibril organization. Sarcomeres, consisting of interdigitating thin filaments (black) and thick filaments (grey) extend from one Z-line to the next and can vary in length with the degree of stretch (e.g., see sarcomere at far right). Thick filaments are symmetric around the M-line in each sarcomere, while thin filament arrays extend with opposite polarity outward from individual Z-lines and do not change length with stretch. For DDecon analysis of thin filament lengths, line scan trajectories should be drawn from M-line to M-line, traversing multiple thin filament arrays. (B) A 12-µm-thick cryosection of mouse tibialis anterior muscle was stained with rhodamine-phalloidin, and a single optical section was collected on a Bio-Rad Radiance 2100 confocal microscope using a Nikon 100× oil objective (NA 1.4) and digital zoom of 3. The yellow line (denoting a line scan position) was drawn across four thin filament arrays, from M-line to M-line. (C) Zoomed-in view of the region in (B) demarcated by the orange dotted lines, showing correspondence between F-actin-free regions of phalloidin-stained skeletal muscle (H-zones) that coincide with the locations of the M-lines in the center of the thick filaments at the ends of the line scan trajectory. Dotted oval indicates a region of tissue damage with poor staining quality that should not be used to collect line scans. Z, Z-line; M, M-line; Sarc, sarcomere; TFA, thin filament array.
