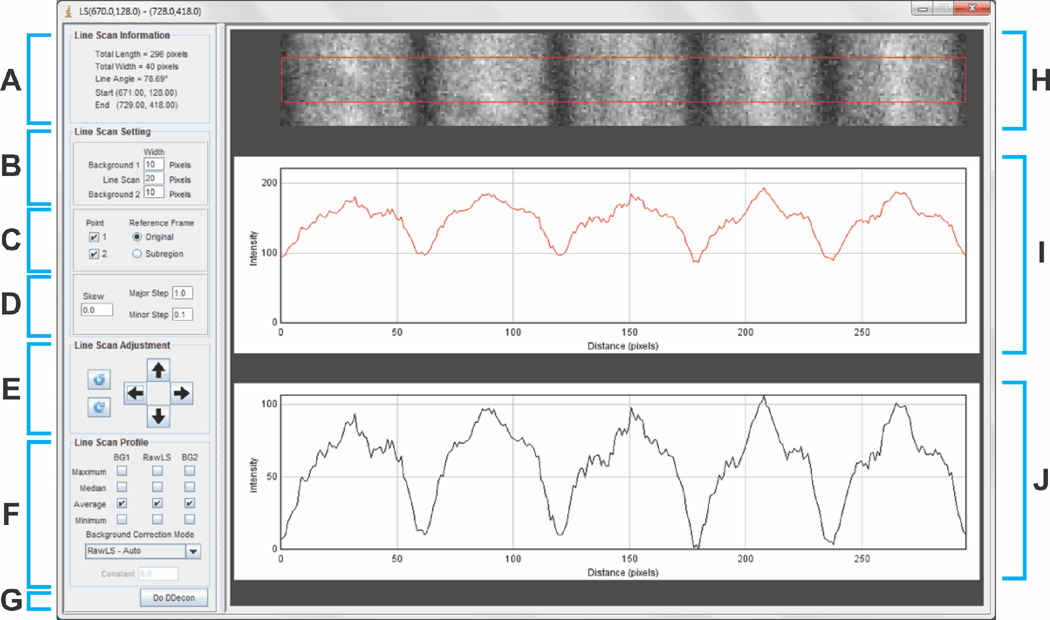
Figure 3. Line Scan screen.
(A) The “Line Scan Information” panel provides metadata about the selected line scan, including length and width of the bounded area surrounding the line scan in which fluorescence intensity is integrated, angle of the line with respect to the reference frame of the image, and start and end coordinates. (B-D) The “Line Scan Setting” panel allows the user to refine the line scan. (B) Adjustment of line scan width as well as width of adjacent regions used for background correction (only used when imaging isolated myofibrils; note that adjacent regions are not suitable for background subtraction in cryosections since they contain the adjacent myofibrils in the tissue). (C) Fixation of start- and endpoints with respect to the original reference frame or the reference frame of the line scan when using the “Line Scan Adjustment” panel. (D) Data parameters for angular skew and major and minor steps for making adjustments to the line scan when using the “Line Scan Adjustment” panel. (E) The “Line Scan Adjustment” panel allows the user to move the line scan up, down, left, and right, as well as rotate the line scan clockwise or counterclockwise. This is useful when the myofibril image is not perfectly horizontally aligned, and is not in the middle of the image in the vertical dimension. (F) The “Line Scan Profile” panel allows selection of background-correction algorithm. Automated background correction, which is based on the average of the local minima along the line scan, is the default selection, and is optimal for line scans of myofibrils from muscle cryosections (as shown here in H). However, when imaging isolated myofibrils, background correction can also be performed based on subtraction of the maximum, minimum, median, or average value of the fluorescence intensity of one or both adjacent regions parallel to the individual myofibril (not shown). (G) The “Do DDecon” button allows the user to proceed to the “DDecon Analysis” screen and perform model fitting. (H) Image region of a myofibril in a cryosection from which fluorescence intensity is integrated (bounded by red box) to create a fluorescence intensity profile of the line scan. Regions above and below the red box are adjacent rectangular regions used for background correction (only used when imaging isolated myofibrils). (I-J) Line scan fluorescence intensity profiles (I) before or (J) after background correction.

