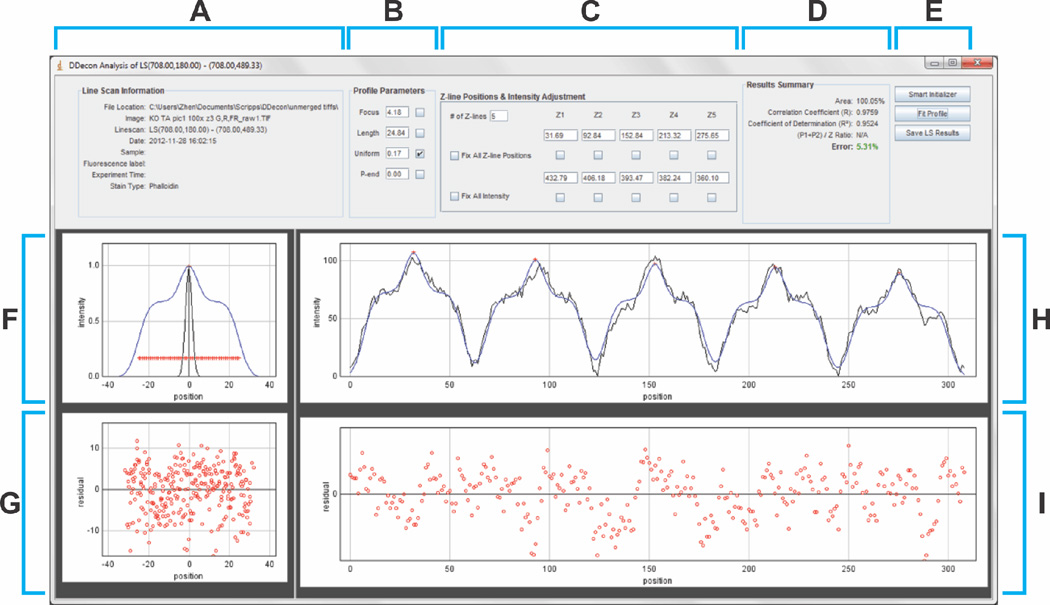
Figure 4. DDecon Analysis screen.
(A) The “Line Scan Information” panel provides metadata about the selected line scan, including file name and location, line scan start- and endpoints, and other information entered in the Launch screen. (B) The “Profile Parameters” panel allows adjustment of the focus, thin filament length, uniform fluorescence, and pointed-end fluorescence of the model profile. (C) The “Z-line Positions & Intensity Adjustment” panel allows adjustment of the number, position, and fluorescence intensity of the center of each model profile (Z-line), corresponding to the number of thin filament arrays traversed by the line scan. (D) The “Results Summary” panel shows statistics describing the goodness-of-fit of the model profile to the experimental data. Most commonly reported statistics include the correlation coefficient (R), coefficient of determination (R2), and percent error. (E) The “Smart Initializer” automatically generates an initial guess for the model fit, the “Fit Profile” button performs the iterative fitting procedure, and the “Save LS Results” button saves the results of the fitting procedure to a tab-delimited text file. (F) Plot of a single model profile representing a computed fluorescence intensity profile for a Z line probe (black line) and a computed fluorescence intensity profile for a probe, such as phalloidin, that labels the entire length of the thin filament in (blue line) (see Table 1 for available model profiles). Red crosshairs indicate coordinates whose abscissas are used for length calculations. (G) Residual plot depicting all model profiles vs. best-fit fluorescence intensity differences for all the thin filament arrays across a line scan, superimposed on one another. (H) Line scan fluorescence intensity profile (black) with best-fit of model profiles (blue) for 5 thin filament arrays. (I) Residual plot depicting model profile vs. best-fit fluorescence intensity differences for the 5 thin filament arrays across the line scan.

