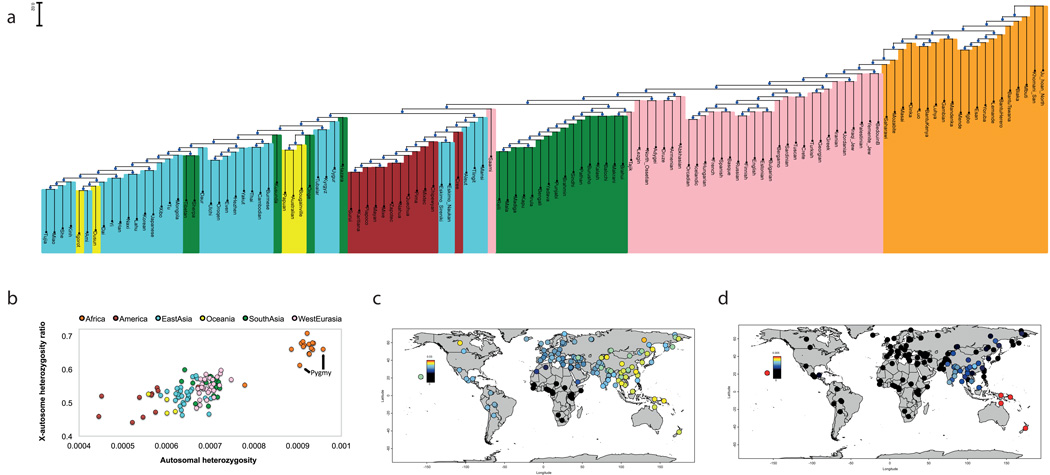
Figure 1. Genetic variation in the SGDP.
A: Neighbor-joining tree of relationships based on pairwise divergence. B: Plot of autosomal heterozygosity against the X-to-autosome heterozygosity ratio, showing the reduction in this ratio in non-Africans and Pygmies. C: Estimate of Neanderthal ancestry with a heatmap scale of 0–3%. D: Estimate of Denisovan ancestry with a heatmap scale of 0–0.5% to bring out subtle differences in mainland Eurasia (Oceanian groups with as much as 5% Denisovan ancestry are saturated in bright red).

