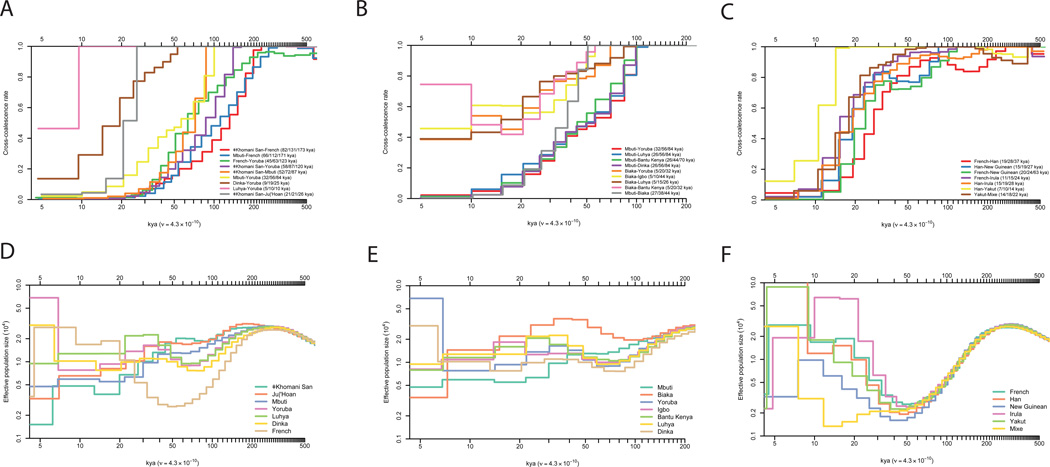
Figure 2. Cross-coalescence rates and effective population sizes for selected population pairs.
A–C: Cross-coalescence rates as a function of time in thousands of years ago (kya) estimated using MSMC, with four haplotypes per pair. In each subfigure legend, we give the point estimate of the date at which 25%, 50% and 75% of lineages in the pair of populations have coalesced into a common ancestral population. We generated these plots using data phased with the 1000 Genomes reference panel (method PS1 described in supplementary information section 9), but only show pairs of populations for which the cross-coalescence rates are relatively insensitive to the phasing approach. A: Selected African cross-coalescence rates. B: Central African rainforest hunter-gatherer cross-coalescence rates. C: Ancient non-African cross coalescence rates. D–F: Effective population sizes inferred using PSMC, using one diploid genome per population, for the same populations that we used in A–C.

