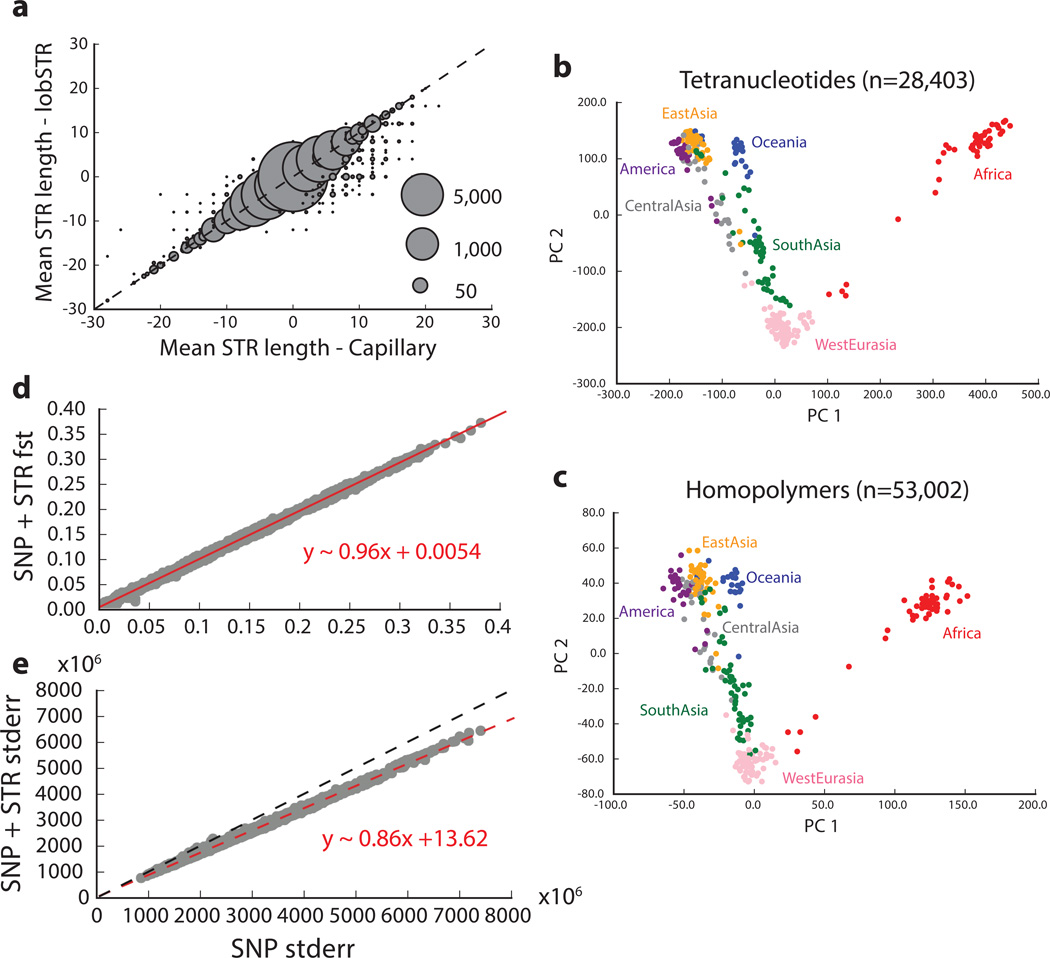
Extended Data Figure 2. Worldwide variation in human short tandem repeats.
A: Mean STR length is reported as the average of the length difference (in base pairs) from the GRCh37 reference for each genotype. Bubble area scales with the number of calls compared at each point. B: and C: show the first two principal components after performing principal component analysis on tetranucleotide and homopolymer genotypes, respectively. Colors represent the region of origin of each sample. D: Pairwise FST values between populations computed using only SNPs vs. using combined SNP+STR loci. E: Block jackknife standard errors for the SNP vs. SNP+STR FST analysis. The red dashed lines give the best-fit line, described by the formula in red. The black dashed line denotes the diagonal.

