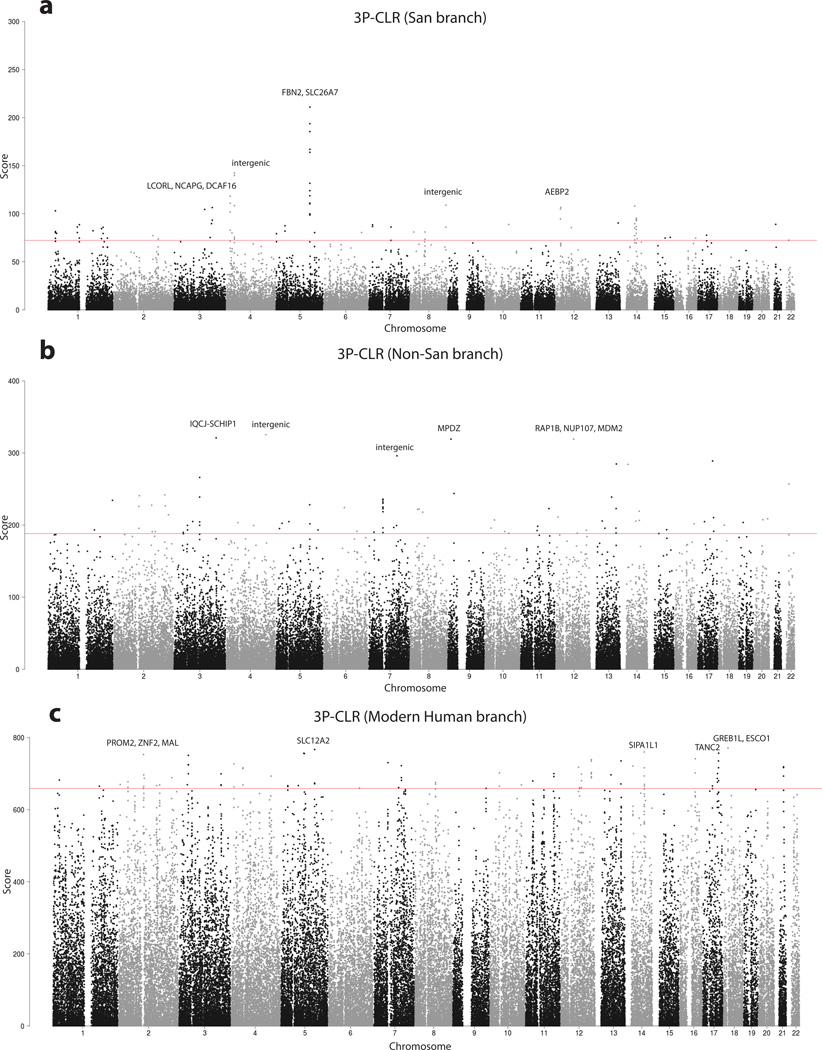
Extended Data Figure 6. 3P-CLR scan for positive selection.
The red line denotes the 99.9% quantile cutoff. The genes in the top 5 regions are labeled. A: Scan for selection on the San terminal branch. B: Scan for selection on the non-San terminal branch. C: Scan for selection on the ancestral modern human branch.

