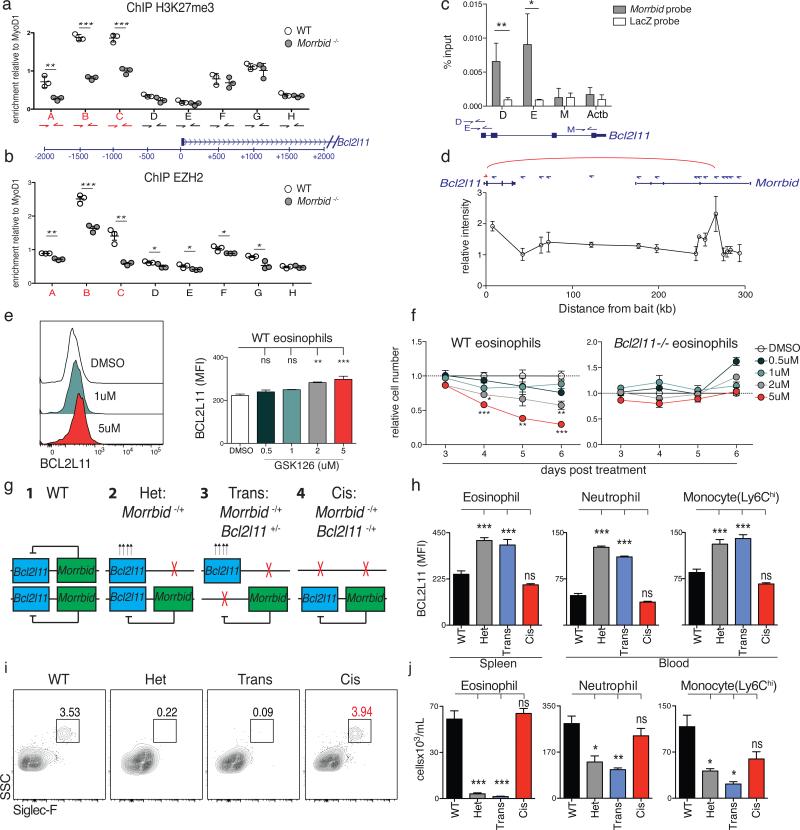
Figure 4. Morrbid represses Bcl2l11 in cis by maintaining its bivalent promoter in a poised state.
(a-b) ChIP-qPCR for (a) H3K27me3 and (b) EZH2 at the Bcl2l11 promoter in sorted bone marrow (BM) neutrophils (dot represents 1-2 pooled mice).
(c) ChIRP-qPCR of Morrbid RNA occupancy (average of 3 independent experiments).
(d) 3C of the Bcl2l11 promoter and indicated genomic regions. (average of 3 independent experiments).
(e-f) WT and Bcl2l11-deficient BM-derived eosinophils treated with the EZH2 inhibitor GSK126. (e) BCL2L11 protein expression on treatment day 5. (f) Number of cells relative to DMSO treatment control (n=3 mice per dose, representative of 2 independent experiments).
(g-j) Allele-specific combinations of Morrbid- and Bcl2l11-deficient mice. (g) Schema.
(h) BCL2L11 MFI of indicated cell-types. (i) Representative flow-cytometry of blood eosinophils. (j) Absolute counts of indicated splenic cell-types (n=3-9 mice per group).
Error bars show s.e.m. *p < 0.05, **p < 0.01, and ***p < 0.001 (two-sided t-test a,b,c; oneway Anova with Tukey post hoc e,f,h,j).

