
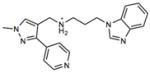
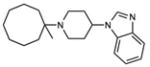
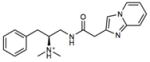
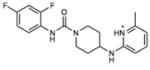
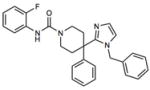
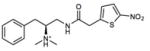
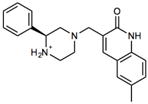
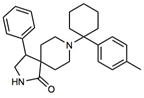
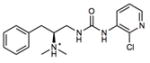
Extended Data Table 1.
Molecules with μOR activity identified in the initial screen
| Cmpd | Structure | Rank | Tca | μOR Ki (μM) | Nearest ChEMBL μOR ligand |
|---|---|---|---|---|---|
| 1 |
|
467 | 0.28 | 7.2 |
|
| 2 |
|
358 | 0.28 | 5.8 |
|
| 3 |
|
1281 | 0.30 | 13.8 |
|
| 4 |
|
1465 | 0.30 | 2.3 |
|
| 5 |
|
2418 | 0.31 | 4.7 |
|
| 6 |
|
2211 | 0.30 | 10.0 |
|
| 7 |
|
1140 | 0.30 | 2.5 |
|
a
The ECFP4 Tanimoto similarity (Tc) to the most similar μOR ligand in ChEMBL16.